
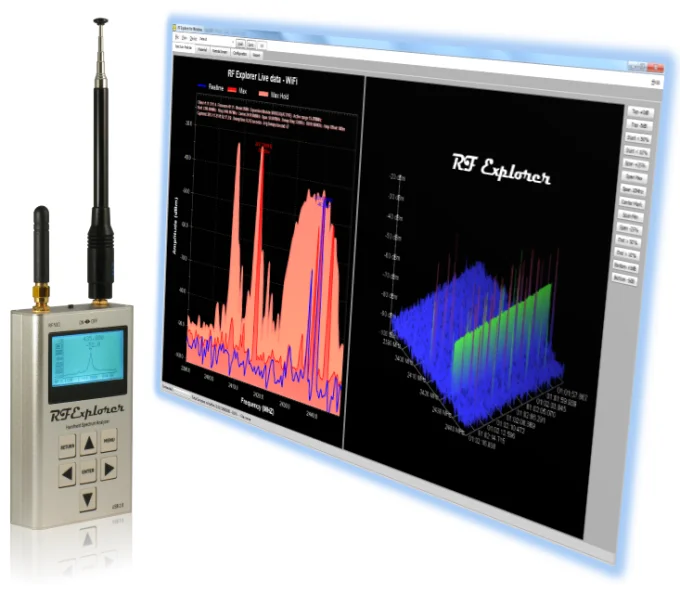
RF Explorer can optionally connect to a Windows PC via USB for enhanced functionality using the RF Explorer for Windows PC Client tool.
For the latest features and updates, please refer to the RF Explorer Windows Client Release Notes to ensure you get the most out of your application.
Note: We recommend using the RF Explorer Touch application instead.
The RF Explorer for Windows application is currently in Maintenance Mode and no longer receives updates or enhancements.
In contrast, RF Explorer Touch offers all new developments and is compatible with touch screens, as well as standard mouse and keyboard setups on any Windows computer.
Visit the RF Explorer Touch page for additional details.
Note: Use a high-quality USB cable to minimize EMC interference from your PC. A good cable should include ferrite beads, shielding, and durable connectors. This not only ensures more accurate measurements but also extends the lifespan of your RF Explorer device.
Silabs CP210x drivers are installed automatically. For USB driver installation issues, refer to our USB drivers article.
Installation
Download the software from the download page. Everything you need is available there.
The Microsoft .NET 4.0 Framework will be automatically installed if it's not already present on your system.
If you don't have the Silicon Labs USB drivers installed, download and install them from the same page. RF Explorer uses an embedded CP2102 USB device for PC connectivity. For troubleshooting USB connectivity issues, visit the USB Troubleshooting article.
Download and upgrade the firmware on your RF Explorer device to the latest version available, as it may be required for certain features of the PC Client to function properly.
Brief instructions, documentation, examples, and test files are included in the Readme.txt file, as well as in the program folder after installation.
Spectrum Analyzer Main Screen
The main screen includes all the functionality needed to perform Spectrum Analyzer measurements on your PC.
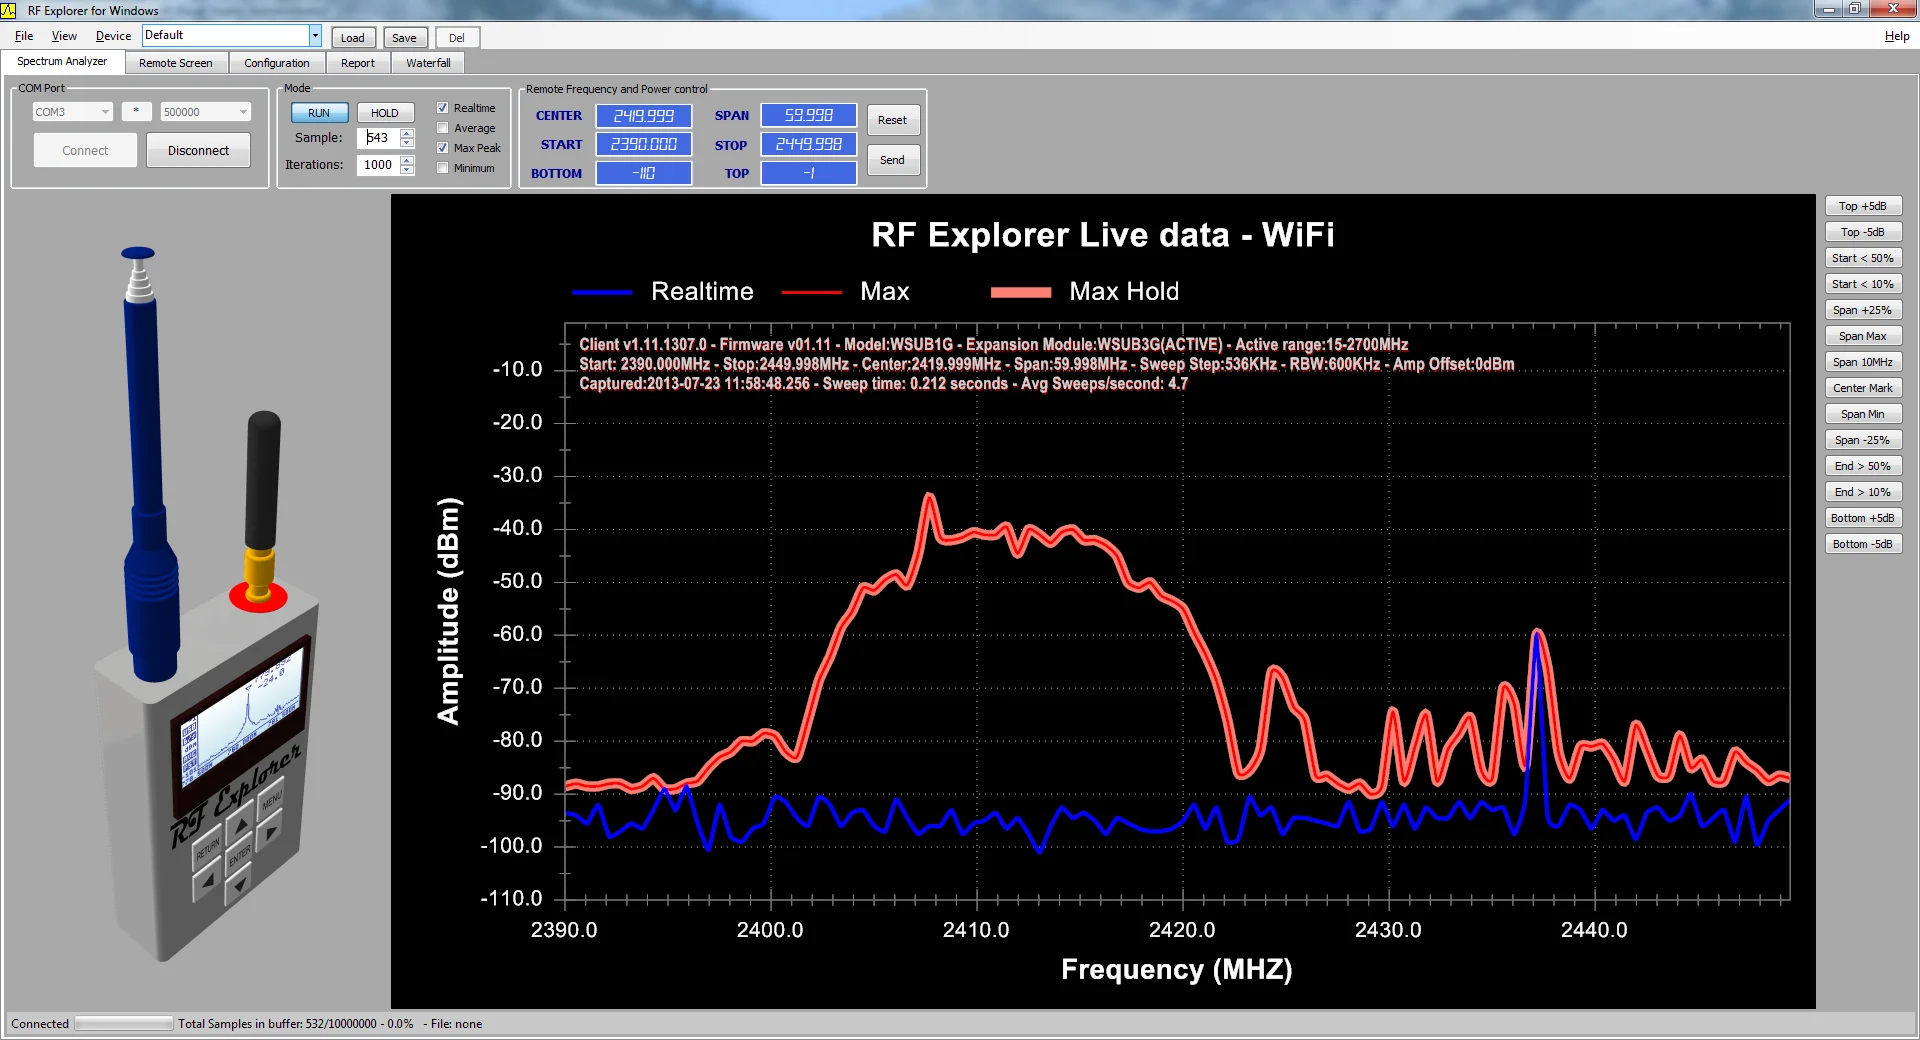
Click on the image to view it in high resolution.
The software will automatically connect to the RF Explorer device if it is available. Otherwise, connect your RF Explorer and click the [*] button to refresh the available USB COM ports.
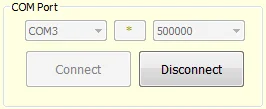
For optimal performance, use the high-speed 500,000 bps mode. If you are using an older USB 1.1 PC or encounter issues, switch to the low-speed 2400 bps mode. However, note that this mode significantly reduces the Spectrum Analyzer refresh rate. To use low-speed mode, configure both the RF Explorer and the PC Client to 2400 bps in the CONFIG MENU.
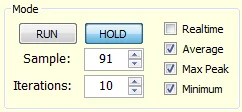
Once connected, the software automatically starts in RUN mode, downloading live data and displaying it on screen. You can stop live data at any time by clicking the HOLD button.
The Sample value indicates how many complete data sweeps have been captured. In RUN mode, the latest data is continuously updated, while in HOLD mode, you can manually navigate through captured data.
The Iterations value determines the number of data samples used for calculations like Average, Max Peak, and Minimum. Realtime data is unaffected by this value. You can select one of the following data representation modes:
- Realtime: Raw data captured with no post-processing.
- Average: Arithmetic mean of the last sampled iterations.
- Max Peak: Maximum value from the last sampled iterations.
- Max Hold: Maximum value from all captured samples, unaffected by Iterations. Available only through the View menu.
- Minimum: Minimum value from the last sampled iterations.

The data screen provides high-speed visualization of Spectrum Analyzer frequency vs. amplitude, just like the RF Explorer device screen. However, it includes advanced features unavailable on the device screen. Right-clicking on the data screen opens a context menu with options to Zoom In, Zoom Out, Print, or export the image as a PNG file. The Copy option allows you to paste the image into other applications.
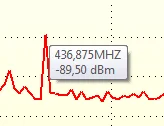
Enabling the "Show Point Values" option allows you to hover over the data graph and view individual data point values.
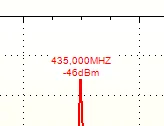
By default, the screen displays the Peak value. This can be disabled through the View → Show Peak Values menu option.
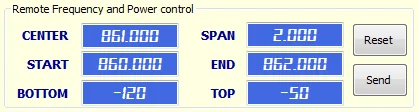
The Spectrum Analyzer configuration of the RF Explorer device can be managed from the Windows PC Client. Adjust frequency and amplitude settings, then click Send to apply the new settings. Use the Reset option to restore the last received configuration before applying changes.
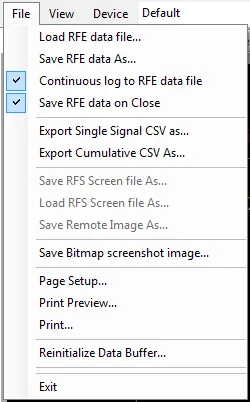
Data can be saved as RFE data files or exported to CSV for use in third-party tools like Excel, IAS, or LabView. For more details, visit this page.
The internal data buffer can be reset to clear previous captures using the "Reinitialize Data Buffer" option. This is done automatically whenever the device's frequency configuration changes. Captured data is saved if the "Continuous log to RFE data file" option is enabled.
Screenshots can be saved using the "Save Bitmap Screenshot Image" option. The file name and contents will vary based on the displayed image.
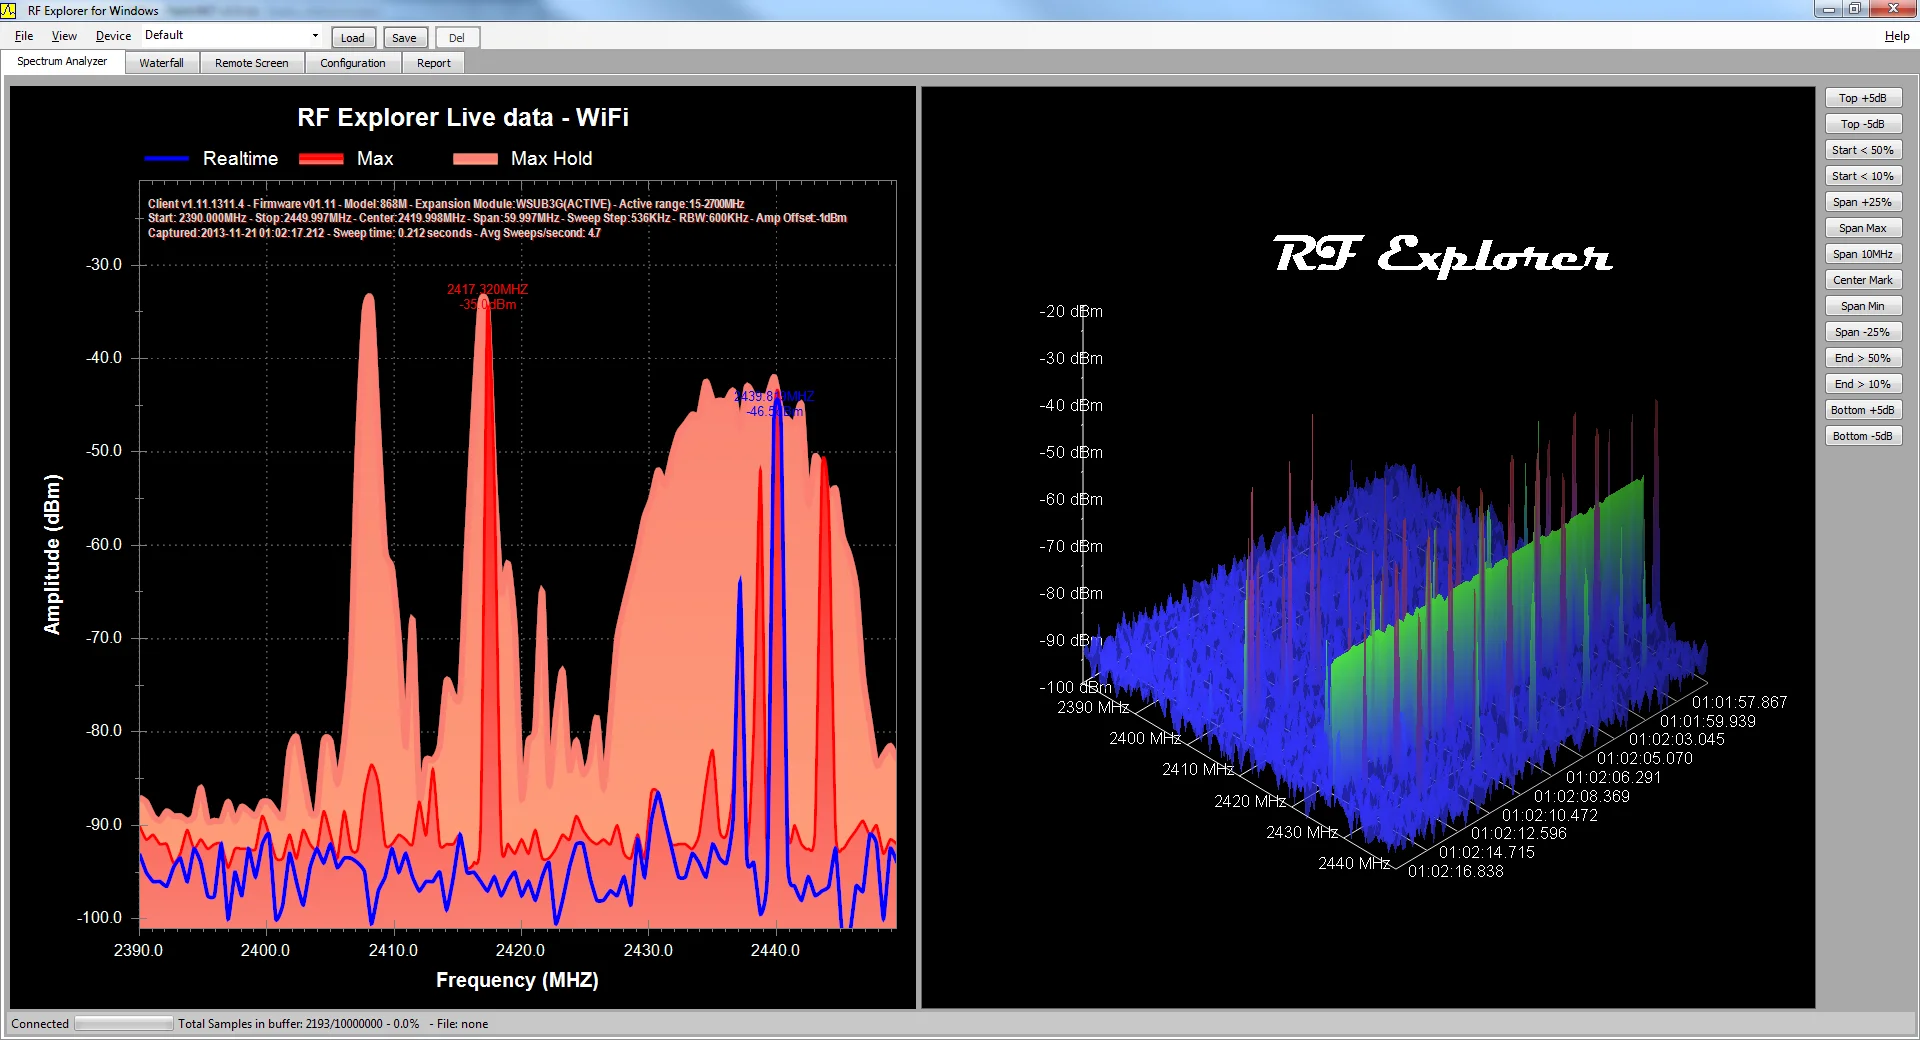
Waterfall Screen
The Waterfall screen provides a powerful and high-performance 2D/3D visualization of historical sweeps. The most recent captured sweep is displayed in the foreground, with older sweeps fading into the background. This view is exceptionally effective for identifying intermittent or time-varying signals that may be difficult to detect through other methods.
The color map of the Waterfall screen is determined by the Top and Bottom amplitude settings of the spectrum analyzer. Signal peaks near the top amplitude display in red, while those near the bottom appear in blue, with a gradient of colors in between. The "heat" of the display's color coding can be dynamically adjusted by modifying the Top and Bottom amplitude settings at any time.

You can choose from four different perspectives, including a 2D view optimized for precise signal analysis.
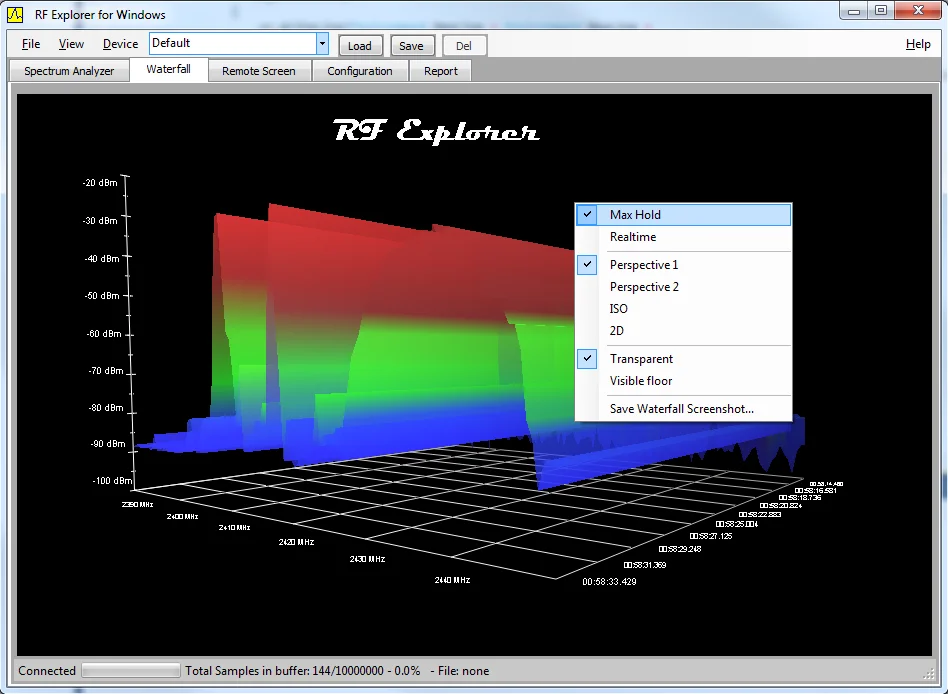
There are several ways to access and display the Waterfall view:
- Use the Waterfall tab screen to display a full-screen waterfall view.
- Right-click on the Waterfall screen to open a context-sensitive menu. Alternatively, these options are also available at the bottom of the View menu.
- Enable the Waterfall display within the Spectrum Analyzer screen by selecting the View menu option Include Waterfall in Main Screen, and choose either the bottom or horizontal layout.
- Save Waterfall screenshots as image files for further analysis or reporting.
Visualization Settings
The tool offers a range of configuration options to customize the display according to your preferences.
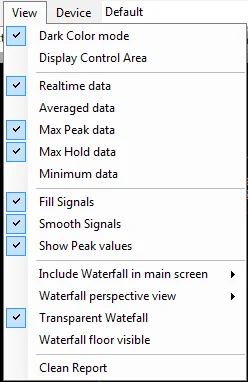
The Dark Color Mode enables a black background skin, similar to desktop instruments, making it easier to read in certain environments. To save ink when printing, this mode is automatically disabled during the print process and restored afterward.
The Fill Signals option fills the area beneath signal shapes for all signals except the Realtime signal.
The Smooth Signals option applies soft splines to connect data sweep points, creating a visually smooth curve. In some scenarios, the calculated curve may not accurately represent raw data points. You can disable smoothing when precise raw data visibility is required. As the interpolation is always an estimate, you can control which mode provides the most accurate representation for your measurements.
Configuration Named Settings
RF Explorer for Windows provides a simple and effective way to save and manage an unlimited number of frequency, span, and amplitude combinations using named configurations.
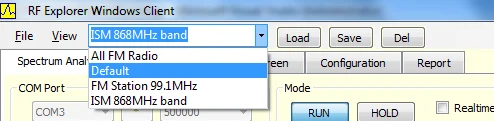
- The "Default" configuration always exists and reflects the most recently selected set of settings, saved automatically by the application.
- Once a specific configuration is selected, its name appears in the graph title for quick identification of the measurement setup.
- To save the current configuration with a custom name, type the desired name into the combo box at the top of the screen, then click the Save button. The current settings will be saved under that name.
- To apply a previously saved configuration, select the desired name from the combo box and click the Load button. The associated frequency, span, and amplitude settings will be restored and, if a connected RF Explorer device is detected, these values will be updated on the device.
- To overwrite an existing configuration with the current settings, select the name from the combo box and click the Save button. The previous settings for that name will be replaced with the new ones.
- To delete a configuration name you no longer need, select it from the combo box and click the Del button.
- All configurations are stored in the RFExplorer_Settings.xml file located in the application's standard data folder. This file can be copied to another computer to export your settings easily.
Device Menu
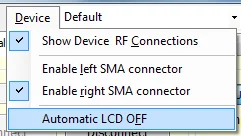
Starting with version v1.11, the Device menu includes options to select the active RF module. For devices like the 3G Combo or ISM Combo with dual SMA connectors, the menu allows you to switch between the Left and Right SMA ports.
A red signal marker on the displayed connector indicates the active port. For example, in the image below, the left port is highlighted in red, showing it is currently enabled.
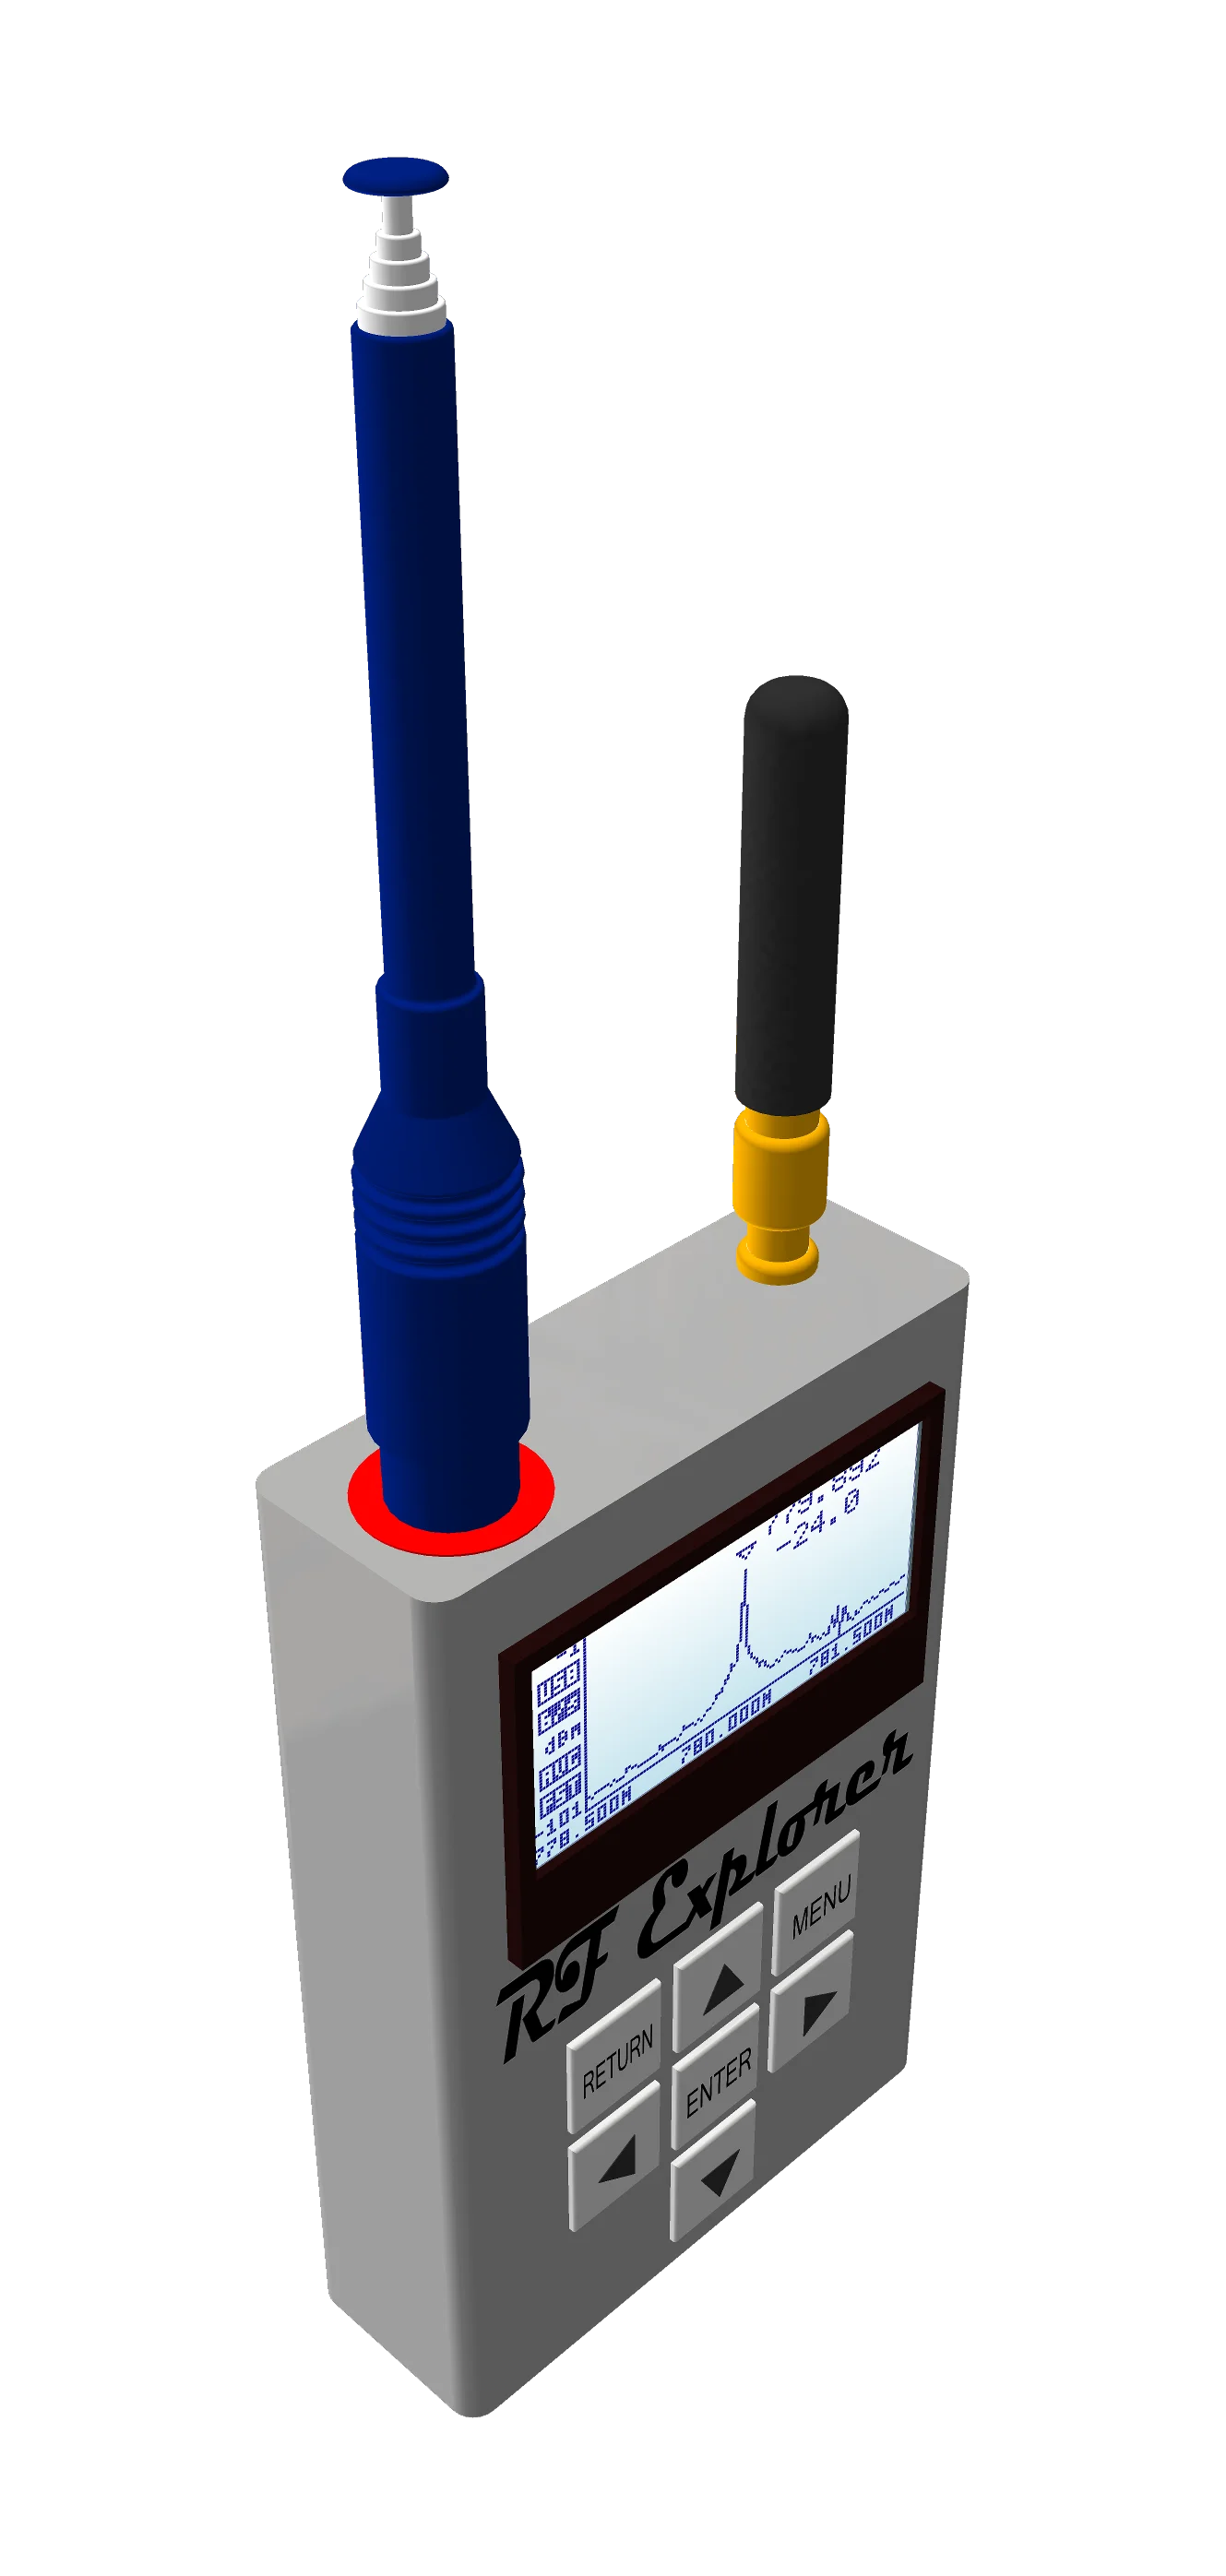
The Show Device RF Connections option toggles the display of the model image for the connected RF Explorer device. The software includes representations for all module combinations; however, the antennas shown are generic and do not reflect the actual antenna or RF source connected, as this cannot be detected by the software.
Enabling the Automatic LCD OFF feature turns off the display on the connected device's LCD screen. This results in faster sweep refresh rates and lower power consumption.
Calibration
RF Explorer supports calibration to achieve optimal frequency accuracy, available for many models starting with firmware version v1.09. To ensure compatibility, visit the download area to get the latest firmware for your device.
Note: Calibration functionality is not yet available for the 2.4G model but is supported for all other RF Explorer models.
Watch this short demo video to see the calibration feature in action.
Remote Screen Tab
The Remote Screen tab provides an exact replica of the RF Explorer screen, making it easy to share data and screenshots with colleagues or friends. This feature is ideal for showcasing what is displayed on your device.
IMPORTANT: Remote screen capture is unavailable if the Automatic LCD OFF feature is active. When the device's LCD is disabled, there is no screen available for capture, and this option will be disabled.
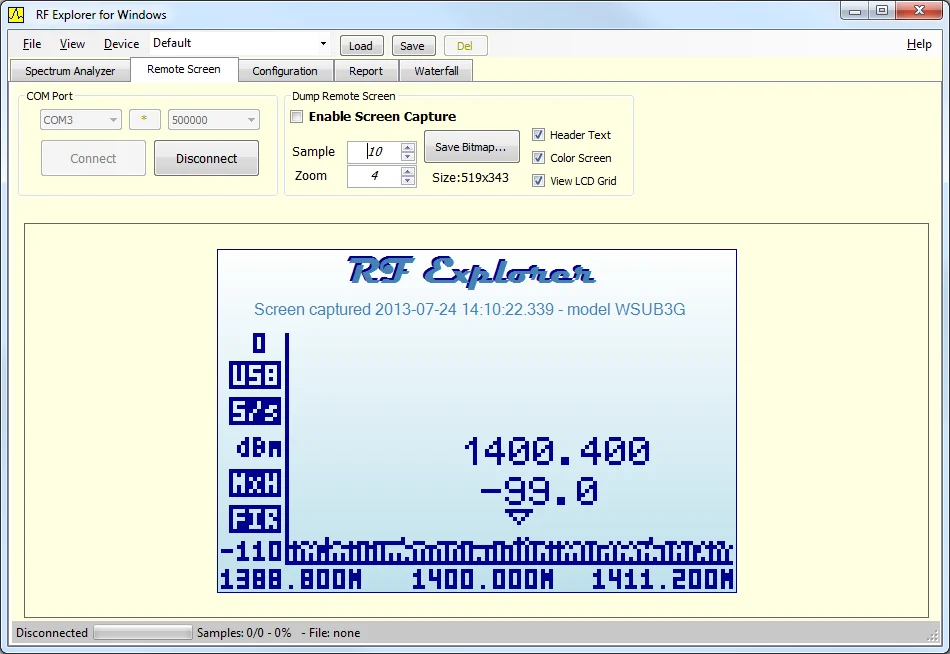
To begin receiving screenshots from RF Explorer, simply enable the Remote Dump Active option. You can stop the process at any time.
The feature allows zooming in and out at various screen sizes, and you can navigate through all captured images by updating the Sample Counter. Starting with v1.11, additional options are available, including the ability to add header descriptive text. For larger screenshots, you can enable or disable the LCD grid effect before saving the bitmap.
Screenshots can be saved as individual PNG files or as RFS capture files. For more details, refer to the RF Explorer File Formats article.
Report Tab
The Report tab provides a technical, low-level data report window primarily intended for diagnostics or debugging purposes. Most users will not need to access this tab unless troubleshooting specific issues.
All data shown in this window is automatically saved to a report file. If you encounter a USB or COM port issue, you may be asked to share this report with our support team to help diagnose and resolve the problem.