RF Explorer Pro Spectrum Analyzer

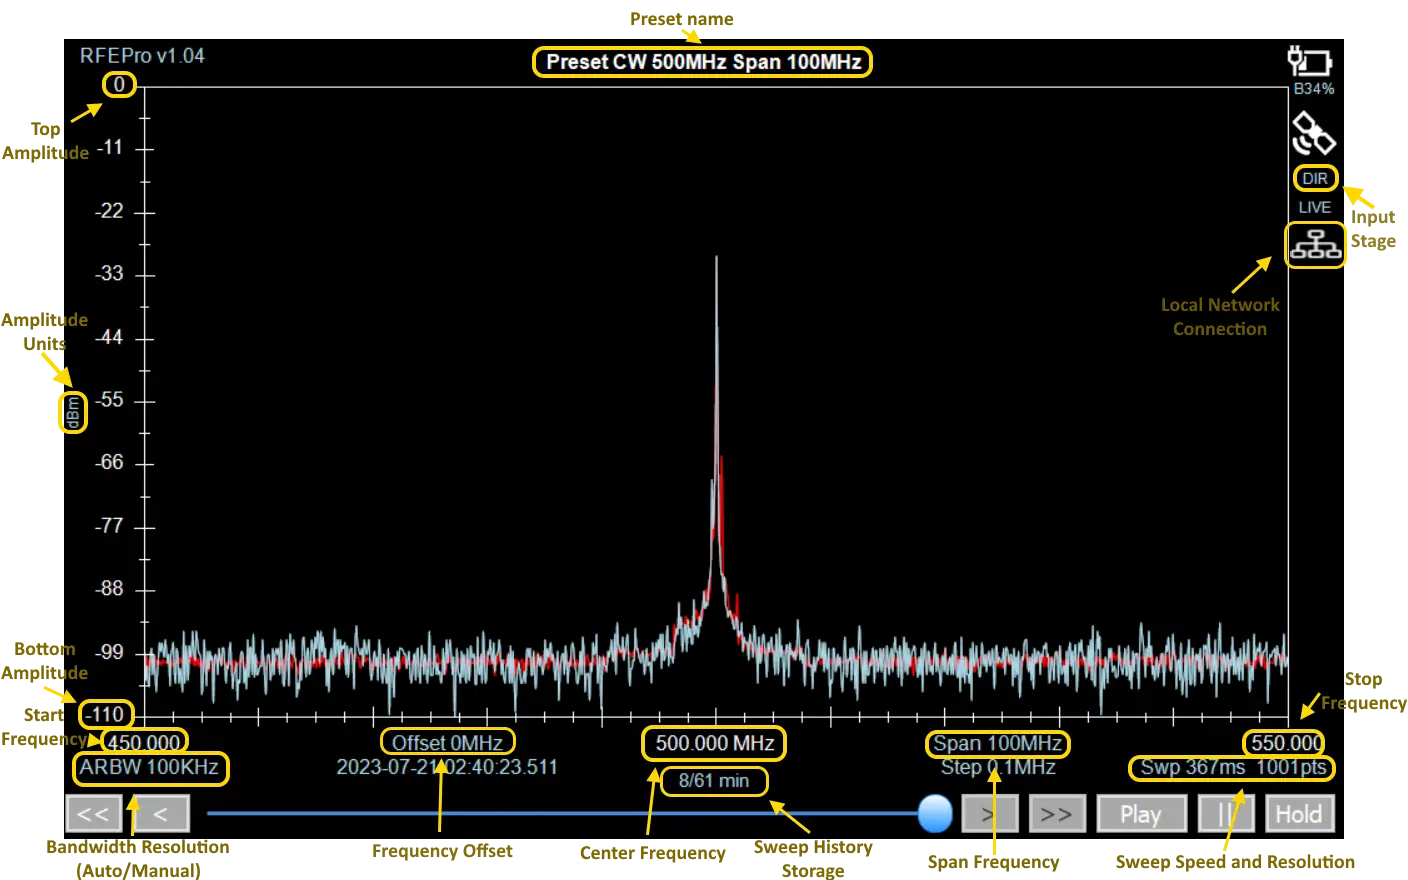
The main screen includes standard spectrum analyzer graph with captured data from RF Explorer device and the right-side menu with all options to use the application easily.

The data screen is a high speed data representation of Spectrum Analyzer Frequency vs Amplitude.

The X axis represents frequency in MHZ and Y axis display actual received power in dBm, dBuV or Watt (selectable).

Touch Gestures

You can use two finger gestures to zoom and pan frequency or amplitude.

  • Zoom in/out - change Frequency Span: Apply two finger gesture towards the horizontal axis to increase or decrease span.
  • Amplitude pan: Move two fingers up or down to pan amplitude
  • Frequency pan: Move two fingers left or right to pan frequency 

Note

  • Zoom and Pan gestures are enabled when Dynamic Marker [DM] feature is disabled ([DM] button icon in grey background)
  • Waterfall spectrometer visible on the main screen available for Spectrum Analyzer and Frequency Coordination modes.
    It can be enabled/disabled, and various options can be selected to change its size, appearance, and detection mode.

Waterfall 2D View

Visualization of historical sweeps incorporated below the main Spectrum Analyzer chart.

Combining the waterfall view with the main graph provides a broader understanding of both instantaneous and historical frequency behaviors, improving overall analysis accuracy.

Waterfall 2D Context Menu

Save Screen…: Saves the current device screen as an image file.

Full Screen Switch: Toggles between the normal view and a full-screen display, providing a clearer view of the spectrum when necessary.

Max Hold ON/OFF: Activates or deactivates the Max Hold mode, which shows the maximum values of all captured samples instead of real-time activity.

Monochromatic ON/OFF: Enables or disables the monochromatic mode, displaying spectrum data using a single color (blue) with varying intensities.

Amplitude Relative/Absolute ON/OFF: Switches between relative and absolute amplitude modes:

Relative: Displays signal intensity using a color gradient relative to the analyzer's dynamic range.

Absolute: Maps colors directly to specific amplitude values.

Set Size…: Adjusts the size of the Waterfall 2D view to occupy 30%, 50%, or 70% of the screen.

Navigation and replay sweep

The navigation bar provides full control to review any past sweep event and also replay sweeps at original captured speed.

This can be used with recently captured data or stored data files.

  • [<<]: Go back multiple sweeps (about 10%)
  • [ < ]: Go back to previous sweep
  • Navigation bar: Point and move to desired sweep. While the scrollbar actuator is being moved, sweep captured date will be updated in real time but spectrum analyzer screen will be updated after releasing the bar.
  • [ > ]: Go forward one sweep
  • [>>]: Go forward multiple sweeps (about 10%)
  • [Play]: Replay captured activity using original captured speed
  • [ || ]: Pause spectrum analyzer activity on screen, but the RF Explorer device continues capturing and storing data
  • [ Hold ]: Fully stop spectrum analyzer activity and data capture. This is the only valid state when using data from file
  • [ Live ]: Restore spectrum analyzer activity and data capture

Hold status

Image

Live status

Image

Touch Labels

Some parameters can be easily configured by screen touch with yellow areas in depicted graph.

Press each of these regions to change:

  • Amplitude Top/Bottom - Change with numeric dialog
  • Start/Center/Stop frequency - Change with numeric dialog
  • Preset name - Set current preset. Note this is not available for Full Screen mode
  • Amplitude Units - Menu Config -> Display
  • Input Stage - Menu Config -> Device
  • Frequency Offset - Change with numeric dialog
  • Span Frequency - Change with numeric dialog
  • Sweep Resolution - Menu Config -> Device
  • RBW - Menu Config -> Device
  • [DM] - Switch between zoom and pan gestures activation and Dynamic Marker feature

Note
The battery level indicator and GPS signal strength are also represented on the right-hand side of the graph, but this icons do not have any touch action when pressed.

GPS icon is only available for Spectrum Analyzer mode