
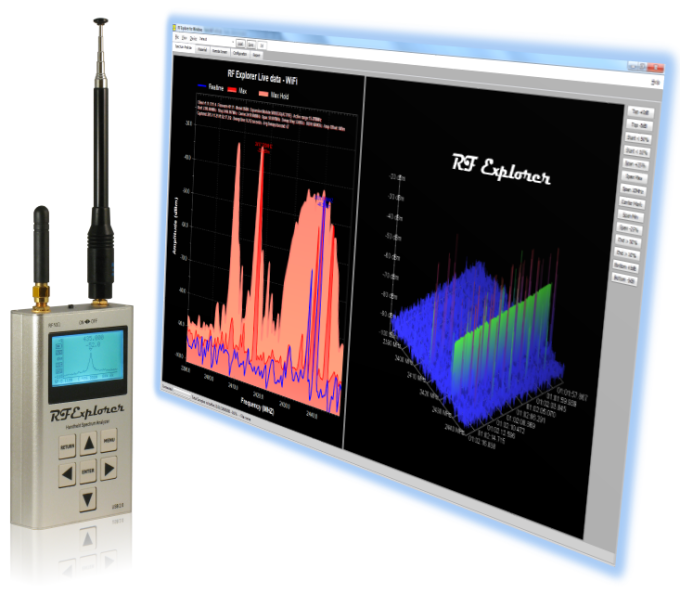
RF Explorer can be optionally connected to a Windows PC USB port for additional functionality using the RF Explorer for Windows PC Client tool.
You can download the software for free and try-before-buy any RF Explorer device. You can even download the full open source code and modify it for your needs!
Latest details on recent versions may not be detailed here yet, so it is always a good idea to check the RF Explorer Windows Client Release Notes to get the most out of your application.
Note: In addition to Windows, there is a GUI client iRF-Explorer available for Mac OSX, developed and offered for free by independent developer Dirk-Willem van Gulik visit AppStore for additional info on connecting RF Explorer with a Mac. We do not offer direct support for the Mac iRF-Explorer tool, please post your questions on the www.rf-explorer.com/forum group for any question.
Note: You should use a high quality USB cable to limit the EMC interference that otherwise a PC would add to your measurements. A high quality cable comes with ferrite beads, it is shielded and more robust than a low price cable but makes a difference when you use it for an instrument like RF Explorer. Good quality connectors used in these cables also extend the life of your device if you connect it frequently.
Silabs CP210x drivers must be installed in your Windows computer for RF Explorer for Windows to connect to the device. Standard Microsoft Windows 7 and newer include this by default. For any issues related to USB drivers, please check this article online: USB drivers
Installation
Download the software from the download page. All you need is there:
Microsoft .NET 4.0 Framework libraries will be automatically installed if not already available in your system.
If you don't have the USB drivers for Silicon Labs download and install them from the same page. RF Explorer uses an embedded CP2102 USB device internally to connect with the PC. If you run into connectivity problems with USB, please check the USB Troubleshooting article.
Download and upgrade the firmware of your RF Explorer device to the latest version available, it may be required for certain functions of the PC Client to work.
There are some brief instructions and documentation in the Readme.txt as well as examples and test files in the package and program file folder after the installation.
Spectrum Analyzer main screen
The main screen includes all the functionality to make Spectrum Analyzer measurements in your PC.
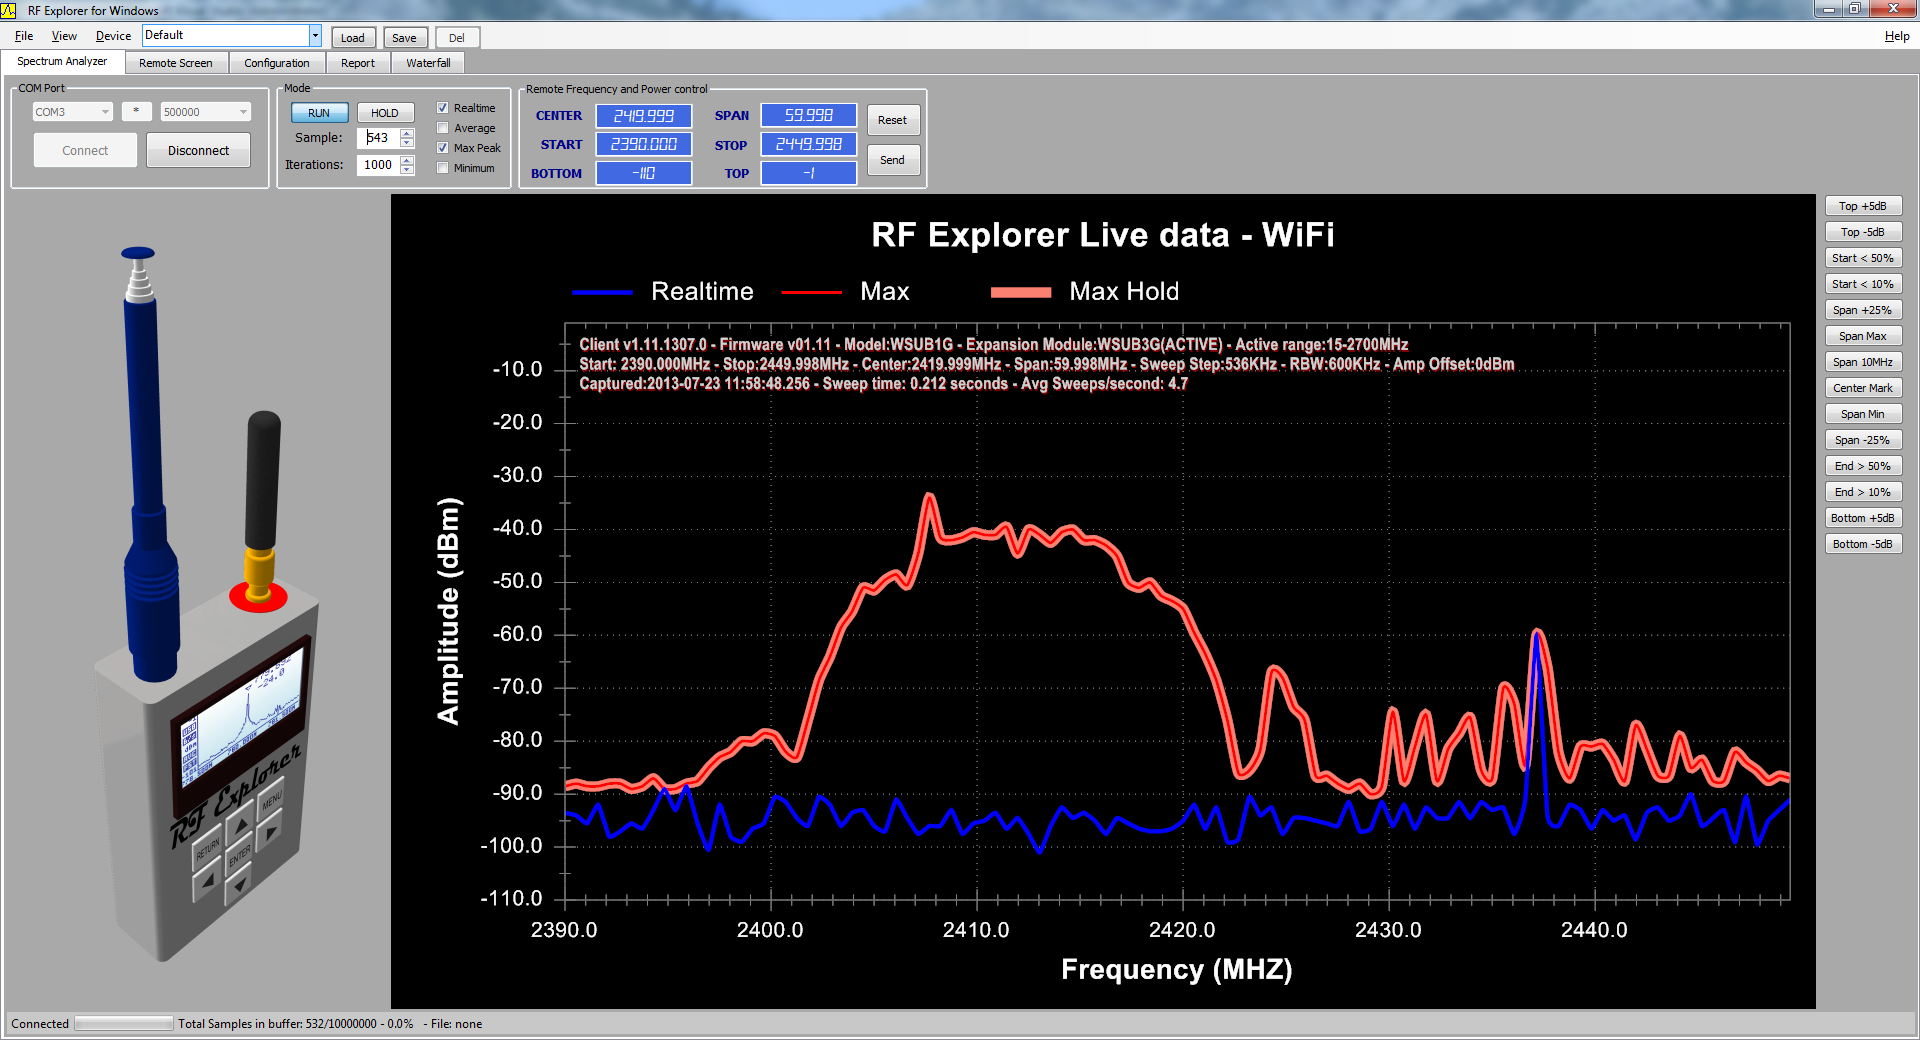
Click on the image to get a high resolution view
The software will connect with RF Explorer device automatically if it is available. Otherwise, connect your RF Explorer and click on the [*] button to refresh the available USB COM ports.
You should use the high speed 500,000bps mode. If you are using a USB 1.1 old PC or have any problem, try the low speed 2400bps but that will take much longer to refresh your PC and the Spectrum Analyzer refresh rate will downscale significantly. Note you need to change the RF Explorer to 2400bps as well in the CONFIG MENU for the low speed mode to work. Both RF Explorer and the PC must use the same connection speed.
When the connection is in place it automatically starts in RUN mode, download live data and displaying it on screen. You can stop live data anytime by clicking on HOLD button.
The Sample value will grow to show how many complete data sweeps have been captured. In RUN mode it always updates to the latest captured data set, whereas in HOLD mode you can manually go back and forth to review captured data.
Iterations value defines how many data samples will be used for the calculator in Average, Max Peak and Minimum. Realtime data is unaffected by the number of iterations. You can select which of the 4 calculator mode data representation will be displayed on screen:
- Realtime: Raw data as captured with no post-processing
- Average: Arithmetic media of all the last iterations sampled
- Max Peak: Maximum value of all the last iterations sampled
- Max Hold: Maximum value of all captured samples regardless Iterations value - this is only available from the View menu
- Minimum: Minimum value of all the last iterations sampled

The data screen is a high speed data representation of Spectrum Analyzer Frequency vs Amplitude, same as with RF Explorer screen. However, you can do a number of advanced actions you cannot do on the smaller device screen. By right clicking on the data screen you open a context menu which offers you ways to Zoom In, Zoom Out, Print data or even export the image as a PNG bitmap file. You can also use Copy in order to have a clipboard copy of the image to be pasted in other Windows applications.
If "Show Point Values" is enabled, you can move the mouse pointer over the data graph and will display data point values one by one.
By default the screen will display the Peak value but can be disabled on the menu View->Show Peak Values option.
The current Spectrum Analyzer configuration of the RF Explorer device connected can be easily controlled from the Windows PC Client software. You can specify frequency and amplitude configuration and then click on Send for the RF Explorer to reconfigure with your new settings. To undo all the edits and go back to RF Explorer settings anytime (before you click on Send) you can use Reset to restore all last values received from the device.
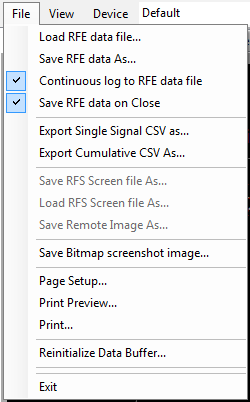
Data can be saved to RFE data files or exported to CSV for use in 3rd party tools such as Excel, IAS or LabView. There is more info here.
Internal data buffer can be reset anytime to clean it from earlier captures by using Reinitialize Data Buffer option. This is done automatically anytime frequency configuration of the device is changed. The previously captured data will be persisted to RFE data file if the "Continuous log to RFE data file" option is set.
Screenshot image being displayed at anytime can be saved to a file with the "Save Bitmap screenshot image" option. The actual filename and contents will vary as a function of the currently displayed image.
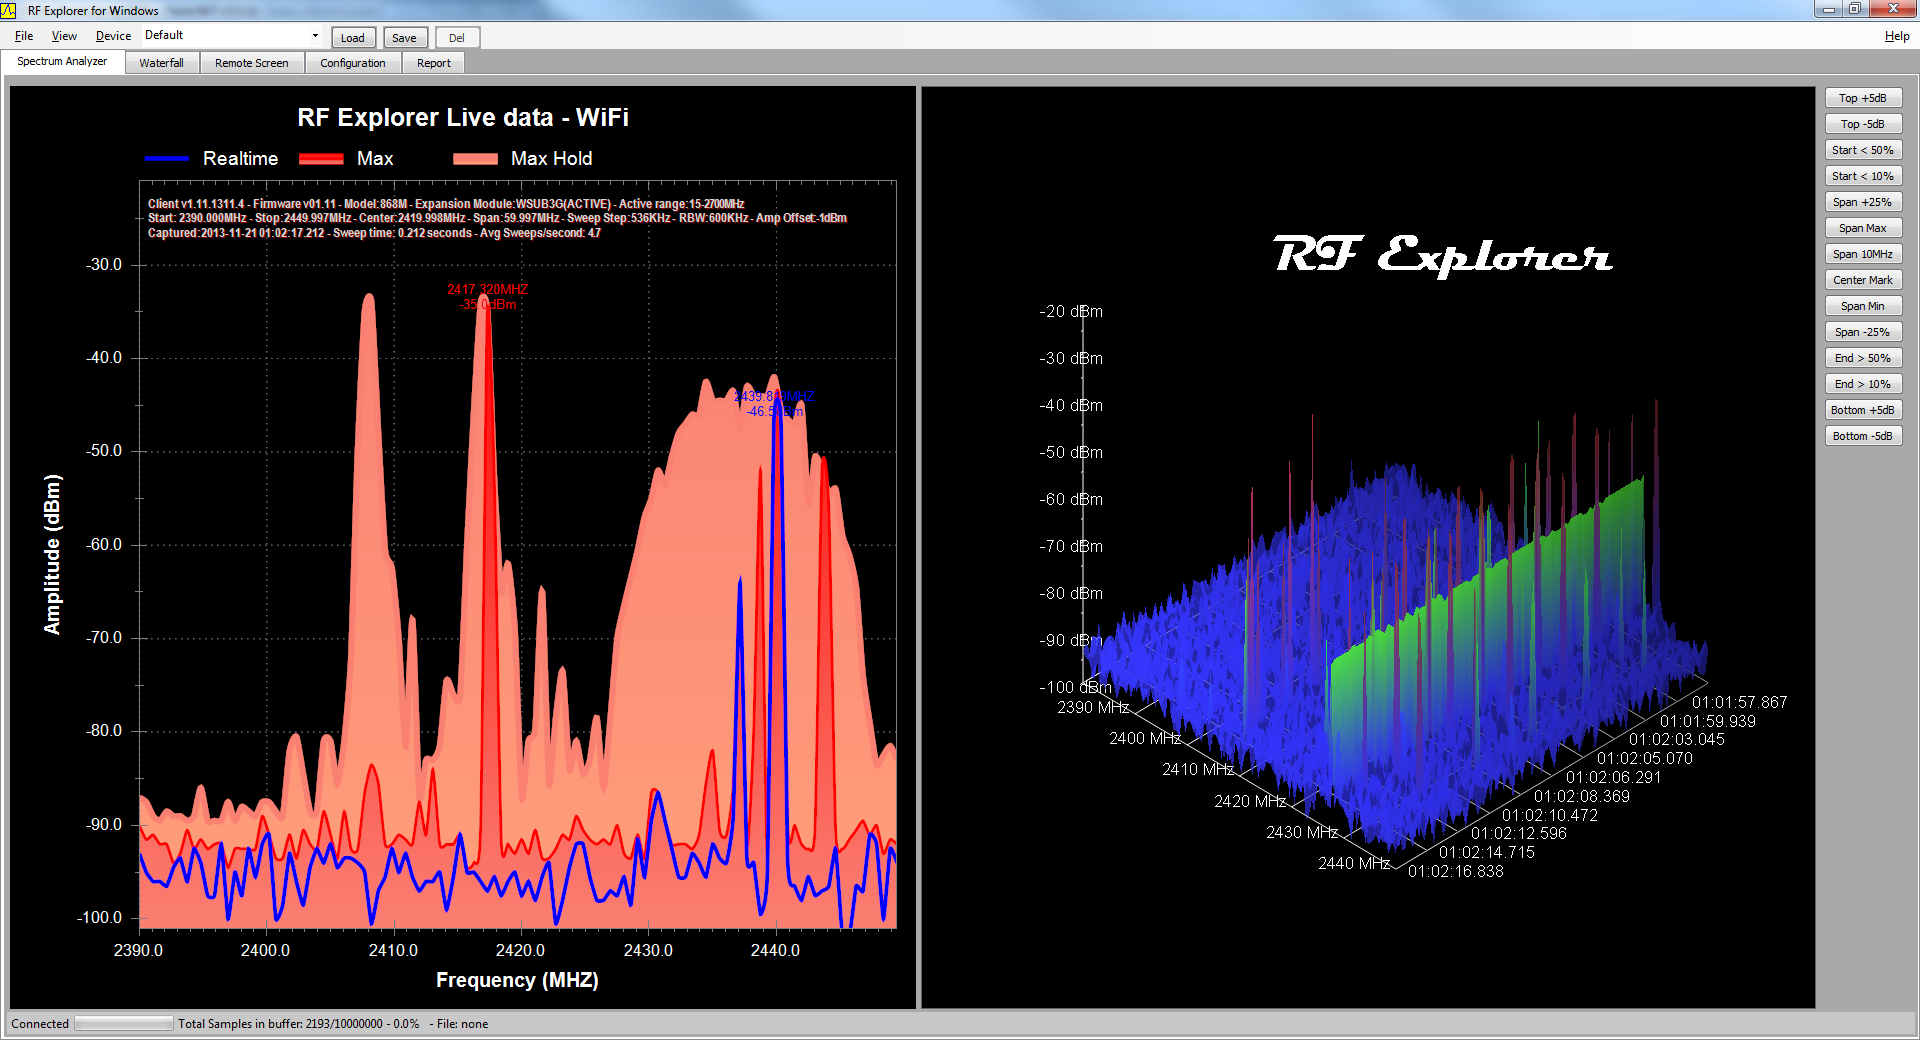
Waterfall screen
This is a powerful, high performance 2D/3D visualization of historical sweeps, displaying the most recent captured sweep in front, with older sweeps in the background. It is a very efficient and practical way to display intermitent or time-changing signals that may not be easy to detect any other way.
The color map used by the Waterfall screen is defined by the Top and Bottom amplitude signals configured on the spectrum analyzer. Signal peaks that are close to the top will show red region whereas signals close to the bottom will display blue, with a color gradient in between. The "heat" of the display color code can be dinamically adjusted by changing the Top and Bottom amplitude settings anytime.

You can choose between 4 different perspectives, including a 2D view that is best suited for accurate signal research.
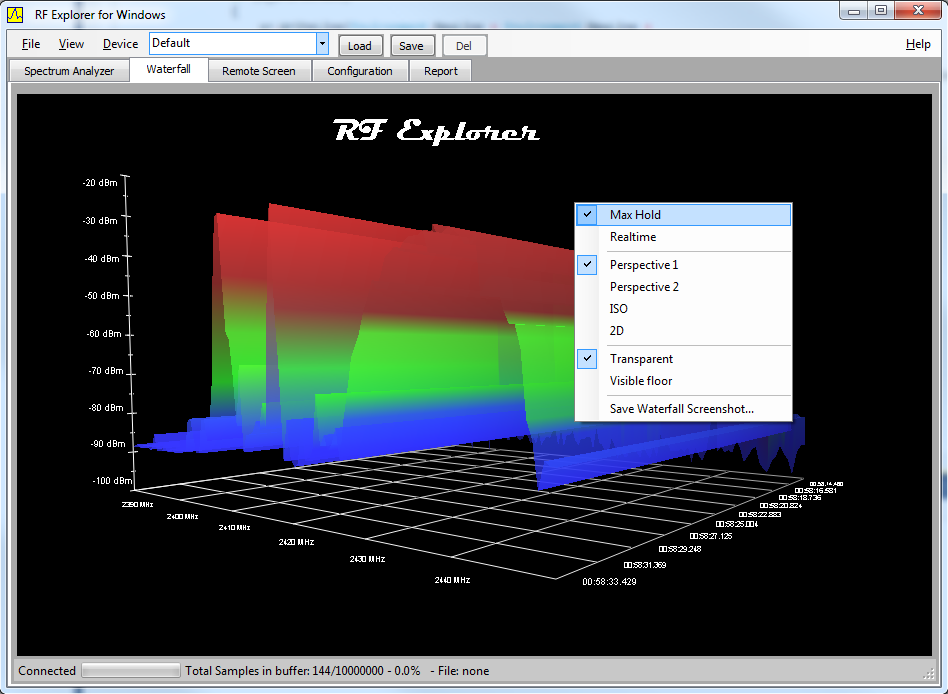
There are multiple options to display the Waterfall view:
- Select the Waterfall tab screen in order to display a full screen waterfall.
- Right click on the waterfall screen anytime to enable a context sensitive menu. Alternatively, these options are available as well at the bottom of the View menu.
- Alternatively, the waterfall display can be enabled on the spectrum analyzer screen, select the View menu option Include Waterfall in main screen and choose bottom or horizontal layout.
- Waterfall screenshots can be saved to an image file.
Visualization settings
The tool offers a number of configuration settings to adapt the display to your own preferences.
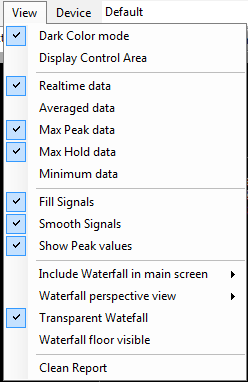
The Dark Color mode will enable a black background skin, closer to desktop instruments and easier to read in certain environments. In this mode, in order to save ink, the tool will disable it temporarily anytime you print but will restore automatically after print is complete.
Fill signals option will display a filled area in all signal shapes except Realtime signal.
Smooth signals option will use soft splines to join data sweep points in order to present a calculated soft curve. In some cases, the curve calculation may be misleading and you may need to disable the smoothing in order to see raw data points accurately. As the interpolation done to join data points is always a calculated "guess", you have control on which guess mode is more accurate for each measurement.
Configuration named settings
In RF Explorer for Windows there is a simple and effective way to save an unlimited number of frequency/span/amplitude combinations identified by configuration names:
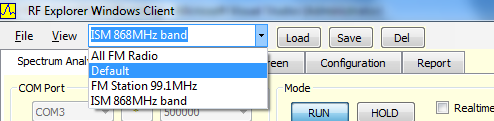
- The "Default" configuration always exist and is the latest selected set of settings, saved transparently by the application.
- After a specific configuration is selected, it becomes part of the graph title for easy reference of measurement configuration
- To store the current configuration with a name, simply type the descriptive name you want on the top-screen combo box, and then click on Save button. The current configuration is persisted with that name.
- To apply the stored settings associated with a name, select the name from the combo list and then click on Load button. The frequency/span/amplitude settings will be restored and, if a RF Explorer device is connected, these values will be updated on it as well.
- To replace an older named configuration with the current settings on screen, select the name from the combo list and then click on Save button. The previously associated settings on that name are replaced with the new ones.
- To delete an old configuration name you no longer use, select the name from the combo list and then click on Del button.
- All these settings are stored in a RFExplorer_Settings.xml file in the standard application data folder. You can easily copy that XML file to another computer if you want to export your settings.
Device Menu
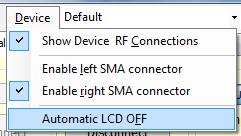
Starting at v1.11, the Device menu includes options to select the active RF module. Left and Right SMA connectors are available menu options when a 2-port RF Explorer such as 3G Combo or ISM Combo is connected.
The red signal mark on the connector will indicate which of the two ports is enabled at any given time, for instance in the image below the left port is red and therefore the one enabled.
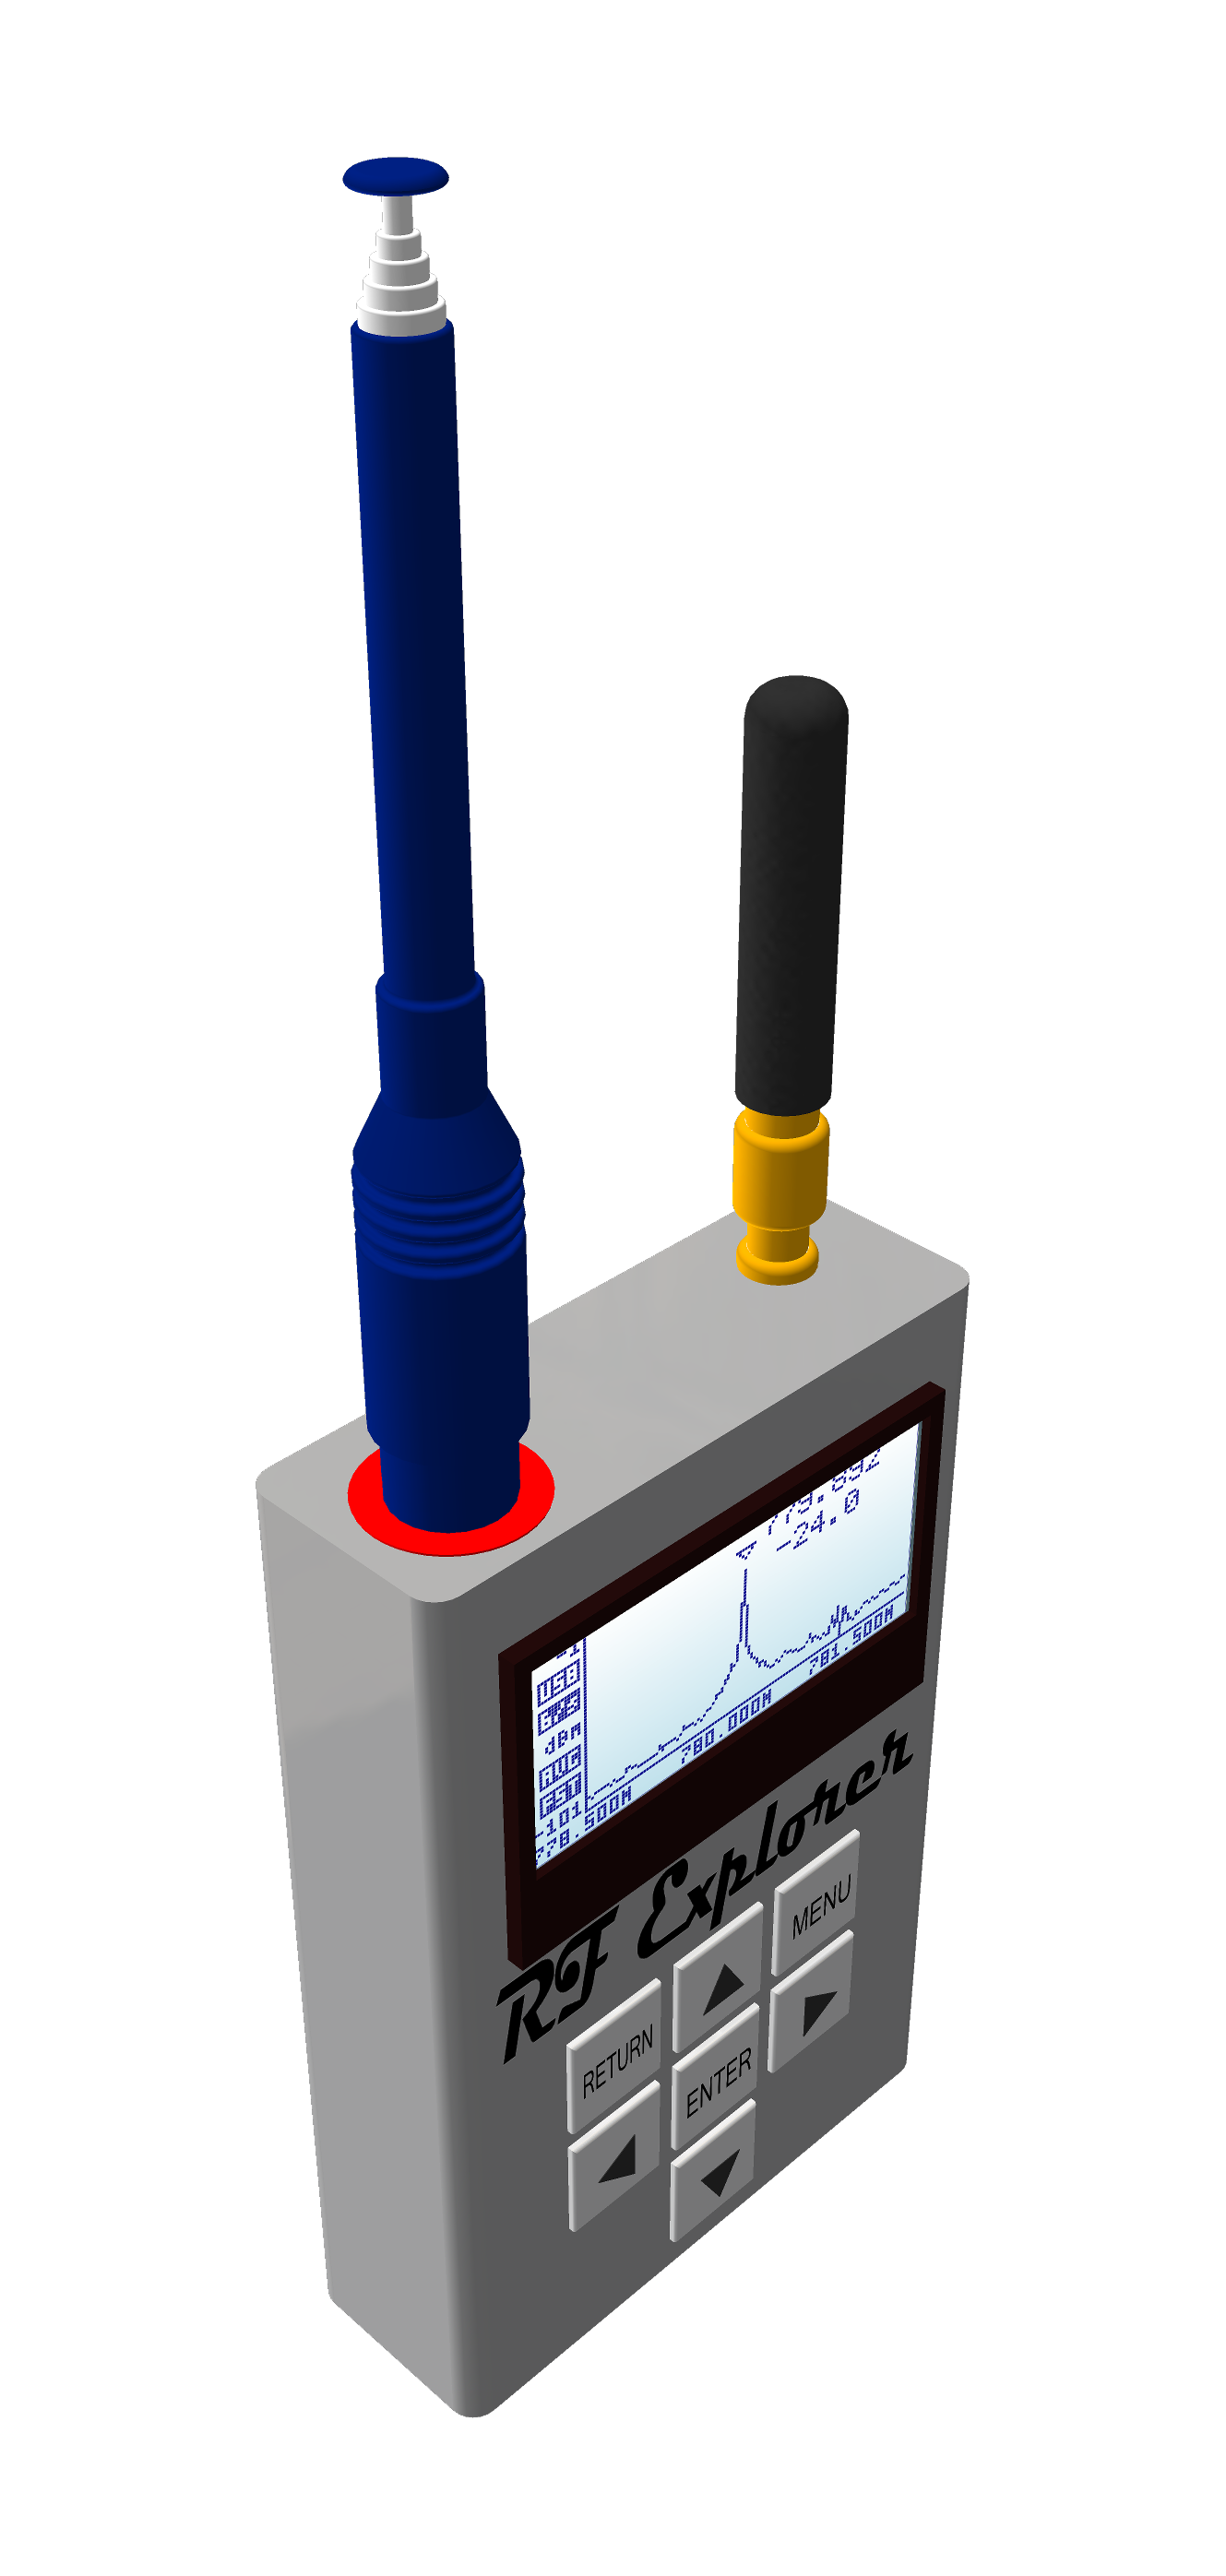
The Show Device RF Connections option will show or hide the model image for the connected RF Explorer device. The software includes models for all possible combinations of modules but the pictured antennas are just a guess, it will not presume a specific antenna or RF source connected as it is impossible for the software to truly know what is connected.
By enabling the Automatic LCD OFF, the connected device will stop displaying images on the LCD screen which has the advantage of some sweep refresh speed increase and certainly a reduction of the power consumption.
Calibration
RF Explorer can be calibrated to get the best possible frequency accuracy, available for several models since firmware version v1.09. Please check download area to get the latest firmware for your device. This feature is not yet available for 2.4G model, but it is for all others.
Short demo video of the calibration functionality in action.
Remote Screen tab
By clicking on "Remote Screen" tab you get access to a exact copy of the RF Explorer screen. This is a wonderful feature to share info and data capture with colleagues and friends to show what you get exactly on your device.
IMPORTANT: the remote dump capture is not available if Automatic LCD OFF is active - that is, if the device has the LCD disabled, there is no possible screen to capture so this option is disabled.
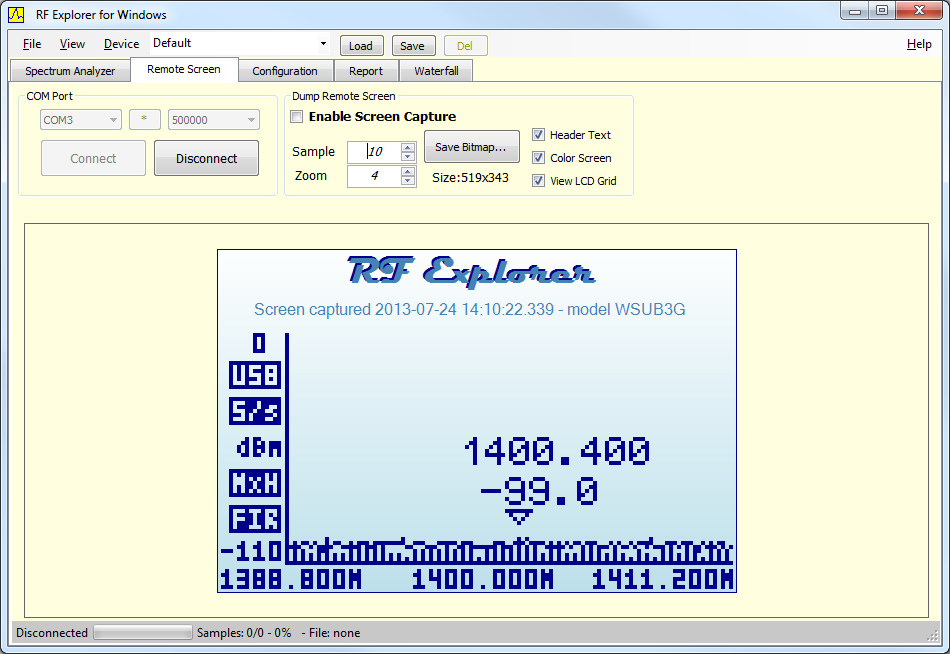
To start receiving screenshots from the RF Explorer, simply check "Remote Dump active" on. You can stop it anytime.
You can also zoom in and out at different screen sizes, and navigate through all the captured images by updating the Sample counter. Starting with v1.11 there are fine options to include header descriptive text and, beyond certain large size, the LCD grid effect can be enabled or disabled before saving the bitmap.
The images can be saved as individual PNG bitmaps or as a RFS capture file. More info see below on RF Explorer file formats article.
Additional notes
Some features still under development or not yet completed are available as separated notes. Please check below:
Report tab
This is technical low level data report window. There is no use of it beyond diagnosis or debug, so you normally won't go there for anything useful except you need to troubleshoot a communication or error problem.
All data in this window is automatically saved to a report file, we may ask for it if we need to work with you to resolve a specific USB or COM issue in your PC.