RF Explorer Pro Manual - Configuration Options

Display options

Application Display

Alphanumeric Keypad

Define preference to use a virtual alphanumeric keyboard.
Note if disabled user must display system keypad manually every time to type text.

Numeric Keypad

Define preference to use a virtual numeric keyboard, useful in touch capable tablets and laptops. Note Frequency and Amplitude numeric dialogs are always active.

Dark Mode

Set a black background skin, closer to desktop instruments and easier to read in certain environments.

Iterations

The number of sweep data iterations to perform calculations on including Average and MaxPeak (not available for Tracking SNA mode).

Device Display

Fill Trace

Display a filled area in all signal shapes except Realtime signal.

Smooth

Use soft splines to join data sweep points in order to present a calculated soft curve

Thick Trace

Display trace with extra width

Show Grid

Show grid inside spectrum analyzer graph

Amplitude Units

Select amplitude units between dBm, dBµV or Watt to display data in analyzer graph.

Waterfall 2D Options

Display in Main Screen

Display waterfall spectrogram in main screen together with the spectrum analyzer graph

Note

Waterfall 2D view is only available for Spectrum Analyzer or Frequency Coordination modes

Realtime

Raw data as captured with no post-processing.

Average

Arithmetic media of all the last iterations sampled.

Max Peak

Maximum value of all the last iterations sampled.

Max Hold

Maximum value of all captured samples regardless Iterations value.

Minimum

Minimum value of all the last iterations sampled.

Note

There are modes where trace visualization is restricted by its own specific captured data type and it is not possible to choose the trace to display on the graph in “Device Display” options, as described below:

• Wifi Analyzer – Max Peak trace

• Power Meter – Real Time trace

• Zero Span – Real Time trace

Tracking Display

Stop Auto Average

Automatically stop SNA tracking after <Average> specified number of sweeps

Insertion Loss (dB)

Evaluate signal insertion loss in dB

Return Loss (dB)

Evaluate the ratio of the reflected power to the incident power in dB

Return loss (VSWR)

Evaluate the ratio of the maximum to minimum voltage on a loss-less transmission line

Device options

Input Stage

Select input stage to enable Direct, Attenuator or LNA.

Low loss signal path to standard sensitivity, use for linear measurements up to -25dBm.

RBW (KHz)

The RBW references the internal filter used to discriminate the bandwidth of each sweep step, this is the frequency span of the final filter that is applied to the input signal

Supported values for Resolution Bandwidth in KHz:

  • Auto: Best RBW definition is calculated over current frequency configuration to get faster sweep scans and is resolved by firmware, RBW manually adjust is not required every time frequency span is set
  • 3, 5, 10, 30, 50, 100, 300, 500, 1000 and 2500

Resolution Bandwidth note

In addition to that, RBW has an important impact on the sensitivity of the Spectrum Analyzer.
The wider the filter bandwidth, the higher the spectral noise and therefore the lower the sensitivity.
This is visible by an increasing noise floor as the RBW is larger, and lower noise floor as the RBW is narrower. Based on this, the narrowest RBW would look like the better choice for all measurements but as you get a narrower RBW you also decrease the scan speed notably, due to the slower nature of narrow filter as well as the need to measure more sweep points to cover the full span.

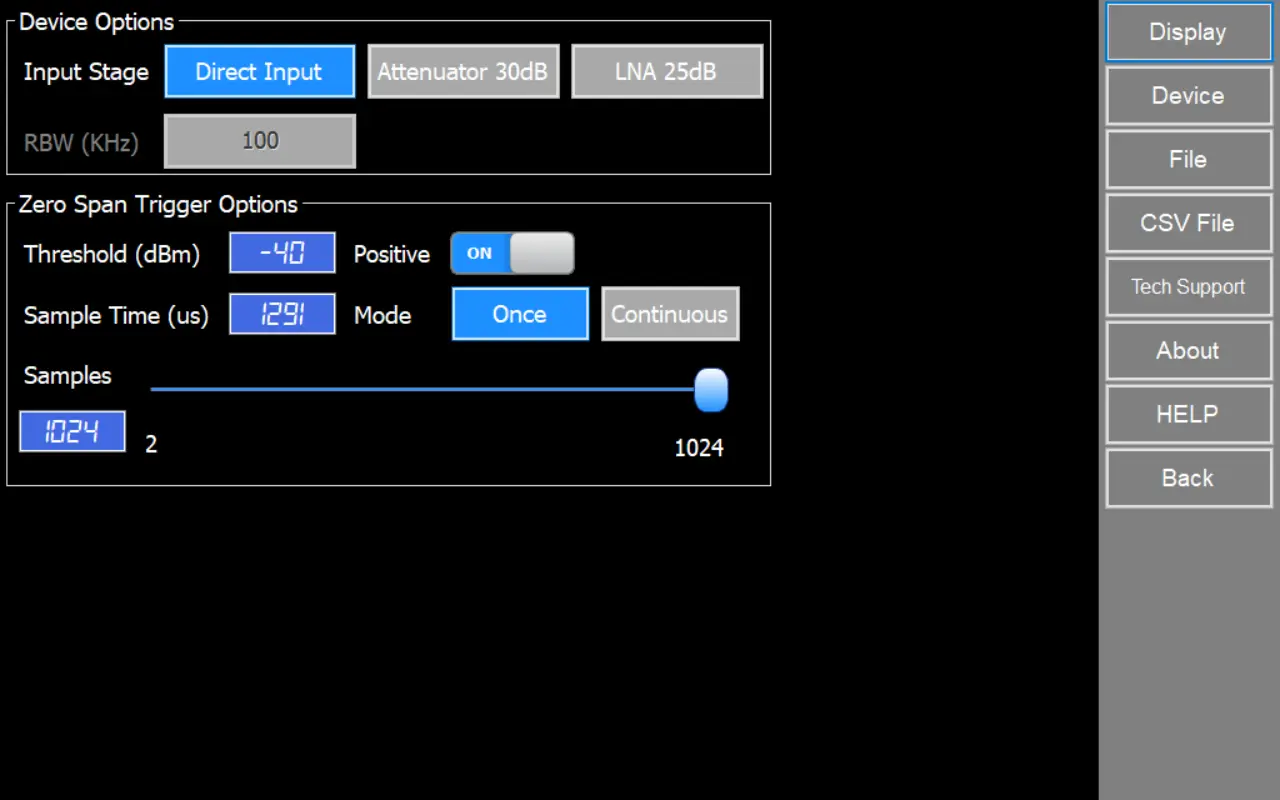
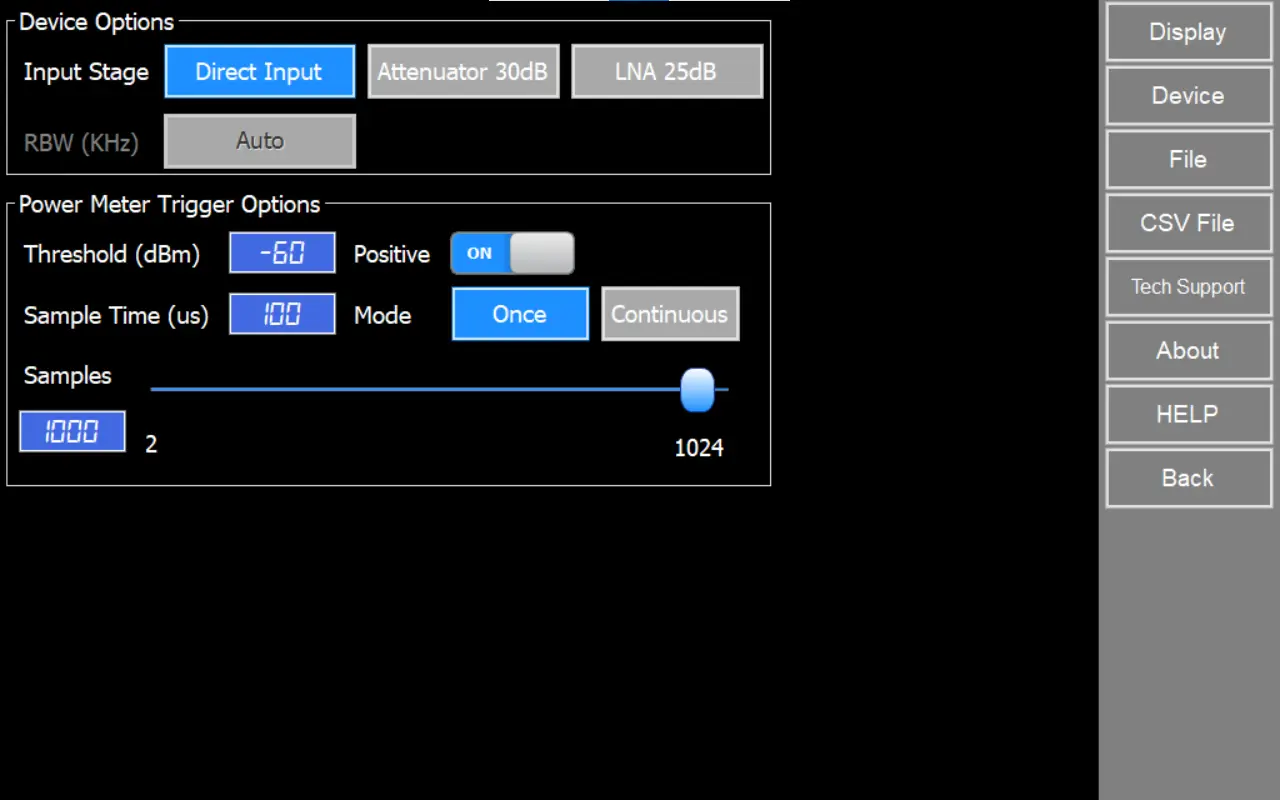
Power Meter and Zero Span Trigger options

Threshold (dBm)

Refers to the minimum signal strength required to capture and display activity data.

Positive

It refers to the threshold, where, if it is positive, the captured signal must exceed the defined threshold to trigger the action. Otherwise, the signal should be lower.

Sample Time (us)

Refers to the time interval or duration between consecutive samples

Mode

  • Once: The trigger action is launched once, and the device stops capturing data
  • Continuous: The trigger is continuously evaluated, and if the threshold is reached, the data is captured and displayed on the graph

Files

File Options

Save RFE Data File on Close

Save a RFE data file every time application is closed. If “Enable Continuous Log” option is enabled, this feature will be enabled automatically.

Continuous log

Enable

Enable continuous log to save RFE data or CSV files periodically in seconds as selected in “Auto Save Delay (s)” option. Also this option save a RFE data file in each configuration change in device and when application is closed.

Auto Save RFE Data

If “Enable” option checked, save a RFE data file every number of seconds selected in “Auto Save Delay (s)” option.

Auto Save CSV

If “Enable” option checked, save a CSV data file every number of seconds selected in “Auto Save Delay (s)” option.

Auto Save Delay (s)

Number of second for Auto-Save feature.

Auto Delete (Days)

Number of days for Auto-Delete old and unused files in user folder

Auto Save Folder

Auto Save Folder Path

Directory where .RFE and CSV files will be stored if Auto Save feature is active

Note

By default files are stored in USB removable drive if available, otherwise the target directory will be “MyDocuments\RFExplorer”.

CSV Files

CSV Options

Field Separator

Delimiter to use for CSV file generation.
Supported separators: Comma, Division, Semicolon, Space or Tabulator.

Decimal Separator

Delimiter to use as decimal separator.
Supported separators: Comma or Dot.

End of Line

End of line to use in for CSV file generation.
Supported end of lines: Line Feed (\n) or Carriage Return and Line Feed (\r\n).

WSM Sennheiser Compatible

When option is checked, CSV files generated can be imported directly in WSM Sennheiser software.

CSV Trace

Selected data trace used to generate the CSV file. There are multiple traces available (such as Real Time or Average) so it is important to select the right one for your needs.

CSV Header

Insert descriptive header inside generated CSV files.

Fields included are:

  • Receiver
  • Date/Time
  • RFUnit
  • Owner
  • ScanCountry
  • CRC

Important

The selected trace must be visible in the Spectrum Analyzer graph, if there are multiple visible the tool will select one by this priority order:

1. Average trace
2. Max Peak trace
3. Real Time trace
4. Max Hold trace
5. Minimum trace

Radio Standards

Feature custom definition of Radio Standard channels. 

You can now import standards or define your own channels to be included in the Spectrum Analyzer graph.

Each channel in a Radio Standard will display:

Channel name

Visual shape of the actual bandwidth and channel position

Computed individual power channel

All parameters of a Radio Standard can be configured in the menu option Config -> Radio Standards -> [Configure...]

This will open a configuration dialog to setup parameters, select which Radio Standards are visible (up to 10 at any given time), import new Radio Standard definitions, etc.

File format

These files are text files you can edit or create with the tool of your choice (e.g. notepad – although we recommend some better editor such as Notepad++)

  1. Go to “Config” menu.
  2. Select “Radio Standard” option.
  3. Click on [Configure…] button.
  4. Check intended Radio Standard on the list.
  5. You can include a suitable description, change color and channel shape, rename it, etc.

Note
 A maximum of 10 Radio Standards can be selected as visible at any given time.

Display Options

To configure Radio Standard display options go to Config -> Radio Standard and click on [Display Options…] button.

Appearance

“Show Channel Shape” option: Enable/Disable Radio Standard channel shape display.

“Show Background” option: Enable/Disable shadow among channel bandwidth display.

“Line Style” option: Define how channels will be drawn. Values:

  • Solid Line
  • Dashes Line
  • Dotted Line
  • Dash and Dot line

Text Settings

“Text Name Channels” option: Enable/Disable channel name display.

“Text Amplitude Values” option: Enable/Disable channel power values display.

“Size” option: Select channel text font size

Limit Lines

An advanced and powerful tool in the spectrum analyzer mode is the ability to work with Minimum and Maximum Limit Lines.

These are fully configurable, visual and optionally audible alarm feature with multi-data point lines to determine power limits.

Operative Limit Line

Limit Lines are fixed thresholds, and only one pair of Max / Min limit lines can be specified at any given time.

These settings apply to one limit line type at a time: maximum or minimum. Use to define or change parameters of each limit line as required.

Different limit lines can be loaded from file or generated from a signal trace anytime.

Limit line type

  • Max: select to apply changes to maximum limit line.
  • Min: select to apply changes to minimum limit line.

Build from signal

Generate maximum or minimum limit line from a currently selected signal trace specifying a positive offset in dB. This offset will be added or subtracted depending on limit line type selected

Save to file

Save maximum or minimum limit line to a limit line file (.rfl).

Read from file

Load maximum or minimum limit line from a limit line file (.rfl).

Remove

Remove maximum or minimum limit line from spectrum analyzer screen.

Common

These settings apply in common to both maximum and minimum limit line

Sound alarm

To enable or disable an audio alarm for as long as the condition is not met

Grips

To enable or disable circle gripped in limit line traces. For high resolution mode, circles might make it hard to see how close limit line trace from signal trace is.

Advanced

Technical Support

Create a compressed ZIP file with activity logs, configuration files and report files in order to diagnose application issues. Only required if requested by RF Explorer Tech Support. 

fas fa-hammer

Factory Default

Restore system configuration setting to Factory Default values. Licenses will be preserved, but Presets and other preference settings will be lost.

Note
This action cannot be undone

fas fa-clipboard-list

About

Show application, Operating System and device details

Also GPS data and status if available.

GPS Status

How to change application appearance

1
In main menu, click on [Config]
2
Click on [Display] button to see display options
3
Check or uncheck “Dark Mode” option.
4
The software will change its appearance with a black theme or white theme including background screen.