
RF Explorer product family offers advanced features when combining Spectrum Analyzer and Signal Generator working together as a Scalar Network Analyzer for 1-port and 2-port RF devices.
In this tutorial we will describe how to use RF Explorer to measure the <return loss> S11 / S22 of a device in dB. The return loss can be described as the fraction of signal reflected back to the source, and therefore we will use the term <reflection> in this document to make it easier to read by non-expert users. The reflection in dB is a parameter used to describe how good the impedance matching when compared to specifications is. In most cases we want to know the reflection of a 50ohm impedance, the higher the reflection, the worse the impedance matching.
The reflection is a measurement of how much energy incident to a device is being reflected back and, therefore, not entering the system. When measured in dB, the following values can be used as indicative:
- Reflection 0dB: all RF energy is being reflected. This is an ideal open or short circuit, equivalent to VSWR=infinite.
- Reflection -3dB: half of the RF energy is being reflected, and thus half of the energy is being received by the device. This is equivalent to VSWR 5.8.
- Reflection -10dB: 1/10th of the RF energy is being reflected. Usually this is the threshold when most devices are considered to be tuned and have a reasonably good impedance matching. This is equivalent to VSWR 1.9.
- Reflection -20dB: 1/100th of the RF energy is being reflected. This is a very good matching, expected for good designed and matched filters. This is equivalent to VSWR 1.2.
- Reflection -30dB or less: 1/1000th or less of the RF energy is being reflected. This is considered exceptionally good matching, and usually found in lab grade devices such as precision attenuators and filters. This is equivalent to VSWR 1.07 or less.
As an example of real world reflection, a narrow band antenna is expected to reflect/reject the RF energy for frequencies that are far from the antenna center tuning frequency, intended by design so the RF input circuit is not overloaded by undesired signals. On the other hand, the narrow band antenna should not reflect but actually be a good receiver for the specific frequency it has been designed for.
Similarly, a good Low Pass Filter (LPF) should offer very small reflection (-10dB or less) for frequencies lower than cutoff frequency, and large reflection (very close to 0dB) for frequencies higher than cutoff frequencies.
With these examples in mind, we will learn how to use RF Explorer SNA to measure reflection in dB.
Items needed
- RF Explorer Signal Generator models
- RF Explorer Spectrum Analyzer model for the required frequency
- 2 or 3 high quality RF cables. We recommend these ones.
- A good 50ohm termination. We recommend this one.
- The device to test (antenna, filter, etc)
- Windows computer with latest RF Explorer for Windows installed.
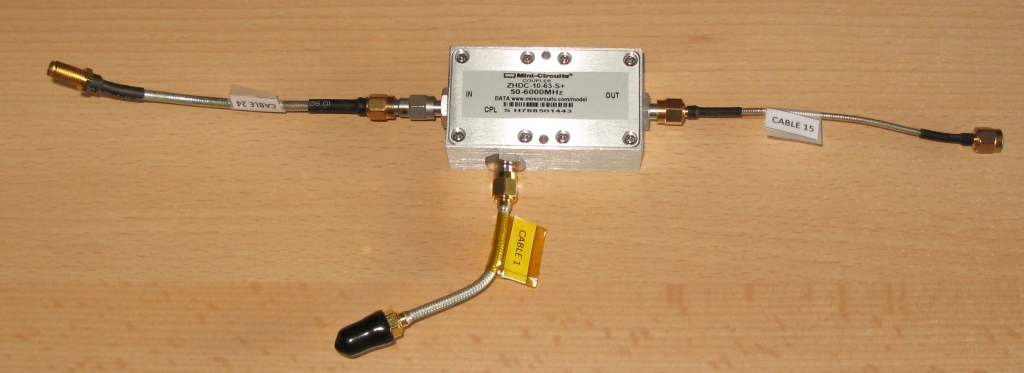
- And last but not least, a good directional coupler. We recommend Mini-Circuits ZHDC-10-63-S+ as a good price/performance device for frequencies range 50MHz - 6GHz with good directivity. If you do not need full wideband support but a more restricted frequency range, you can consider a lower cost limited bandwidth coupler. Select one with 30dB directivity or more for best results, and never use couplers with directivity lower than 20dB. Look at this article for other options.
(click on images to get a larger view)
Normalizing
This step is required so the components are calibrated for use with the SNA and all signal references are internally recorded by RF Explorer for Windows. All measurements done with a SNA start with a normalization step, and reflection measurement is no exception.
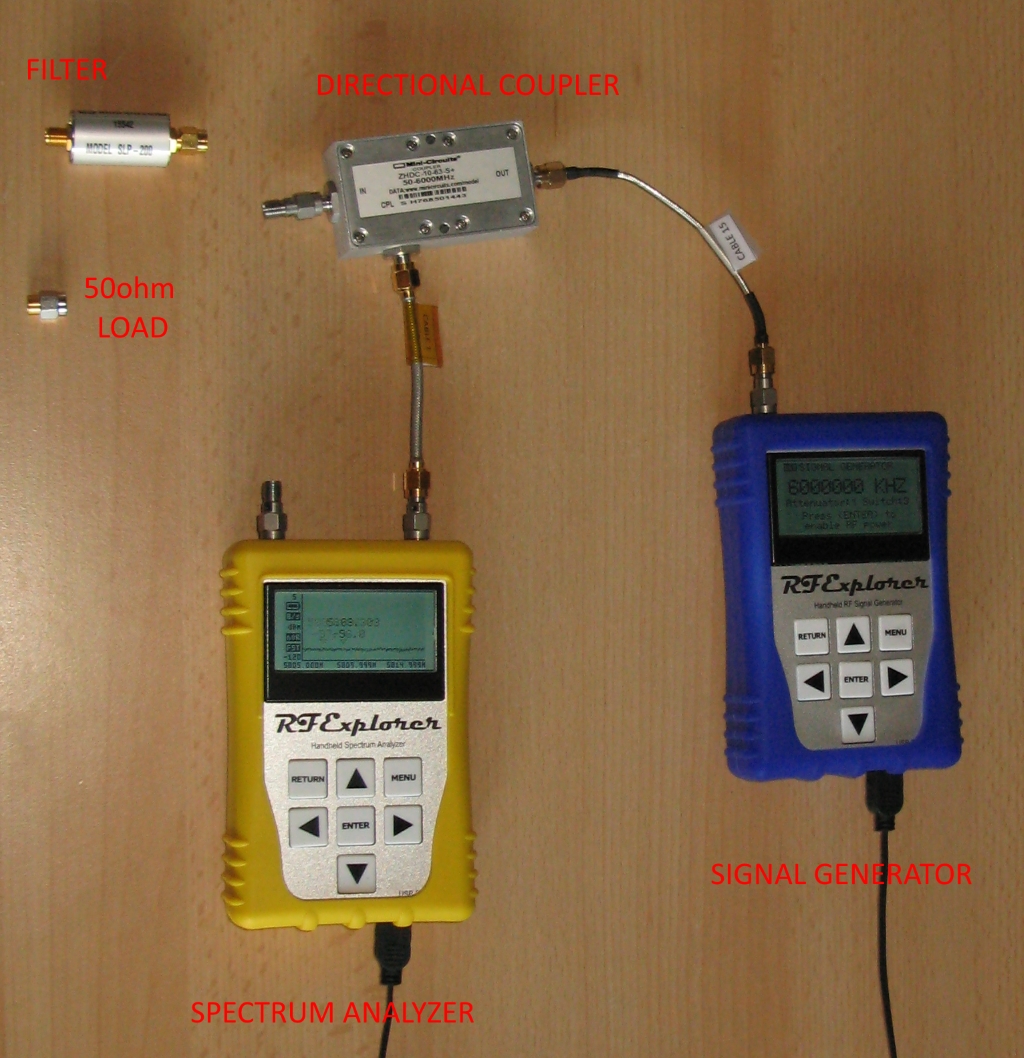
The most confusing detail for novice users is how to correctly connect a directional coupler for reflection measurement. See example below on how to connect for normalization. Note the open (unconnected) INPUT port in the directional coupler.
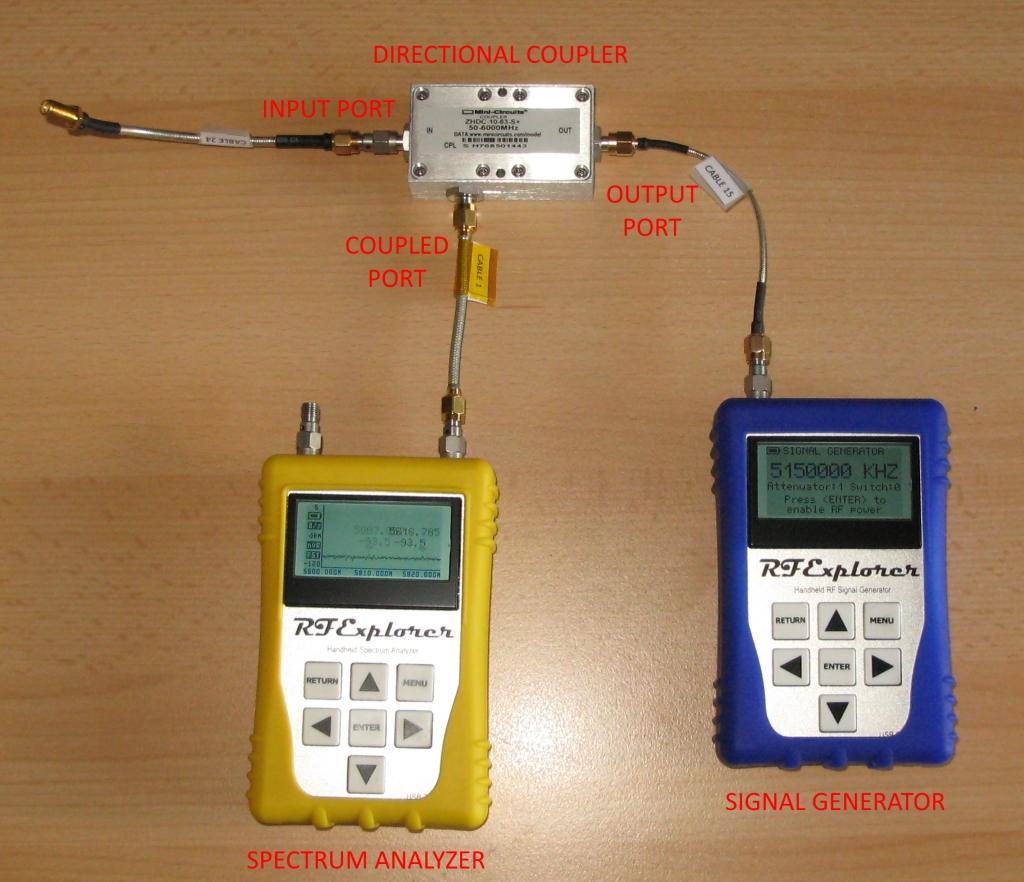
- Connect RF Explorer Signal Generator to the OUTPUT port of the directional coupler
- Connect RF Explorer Spectrum Analyzer to the COUPLED port of the directional coupler
- Keep the INPUT port of the directional coupler OPEN for normalization step. If you need a cable to later connect the antenna with the right orientation, then add the same cable to the INPUT port but keep the cable end OPEN.
- Connect RF Explorer Spectrum Analyzer to the computer USB port
- Load RF Explorer for Windows. The RF Explorer Spectrum Analyzer should be automatically connected.
- Connect RF Explorer Signal Generator to the same computer, different USB port
- Using the Signal Generator tab in the RF Explorer for Windows tool, find the right COM port and click on Connect. At this point both Analyzer and Generator should be connected and therefore the SNA functionality is available.
- Select Power=-30dBm for directional couplers with coupled port of 10dB or less, as the one recommended. If you are using a coupler with a coupled port of 20dB or more, you may need to increase power up to -10dBm.
- Select Start/Stop frequency you are trying to characterize response for. Select steps in the range of 25-50 to start with, you may want to increase to 100-200 for ultra-detailed graph, at the cost of slower trace updates.
- Click on [Normalize SNA…] button, wait till the process completes.
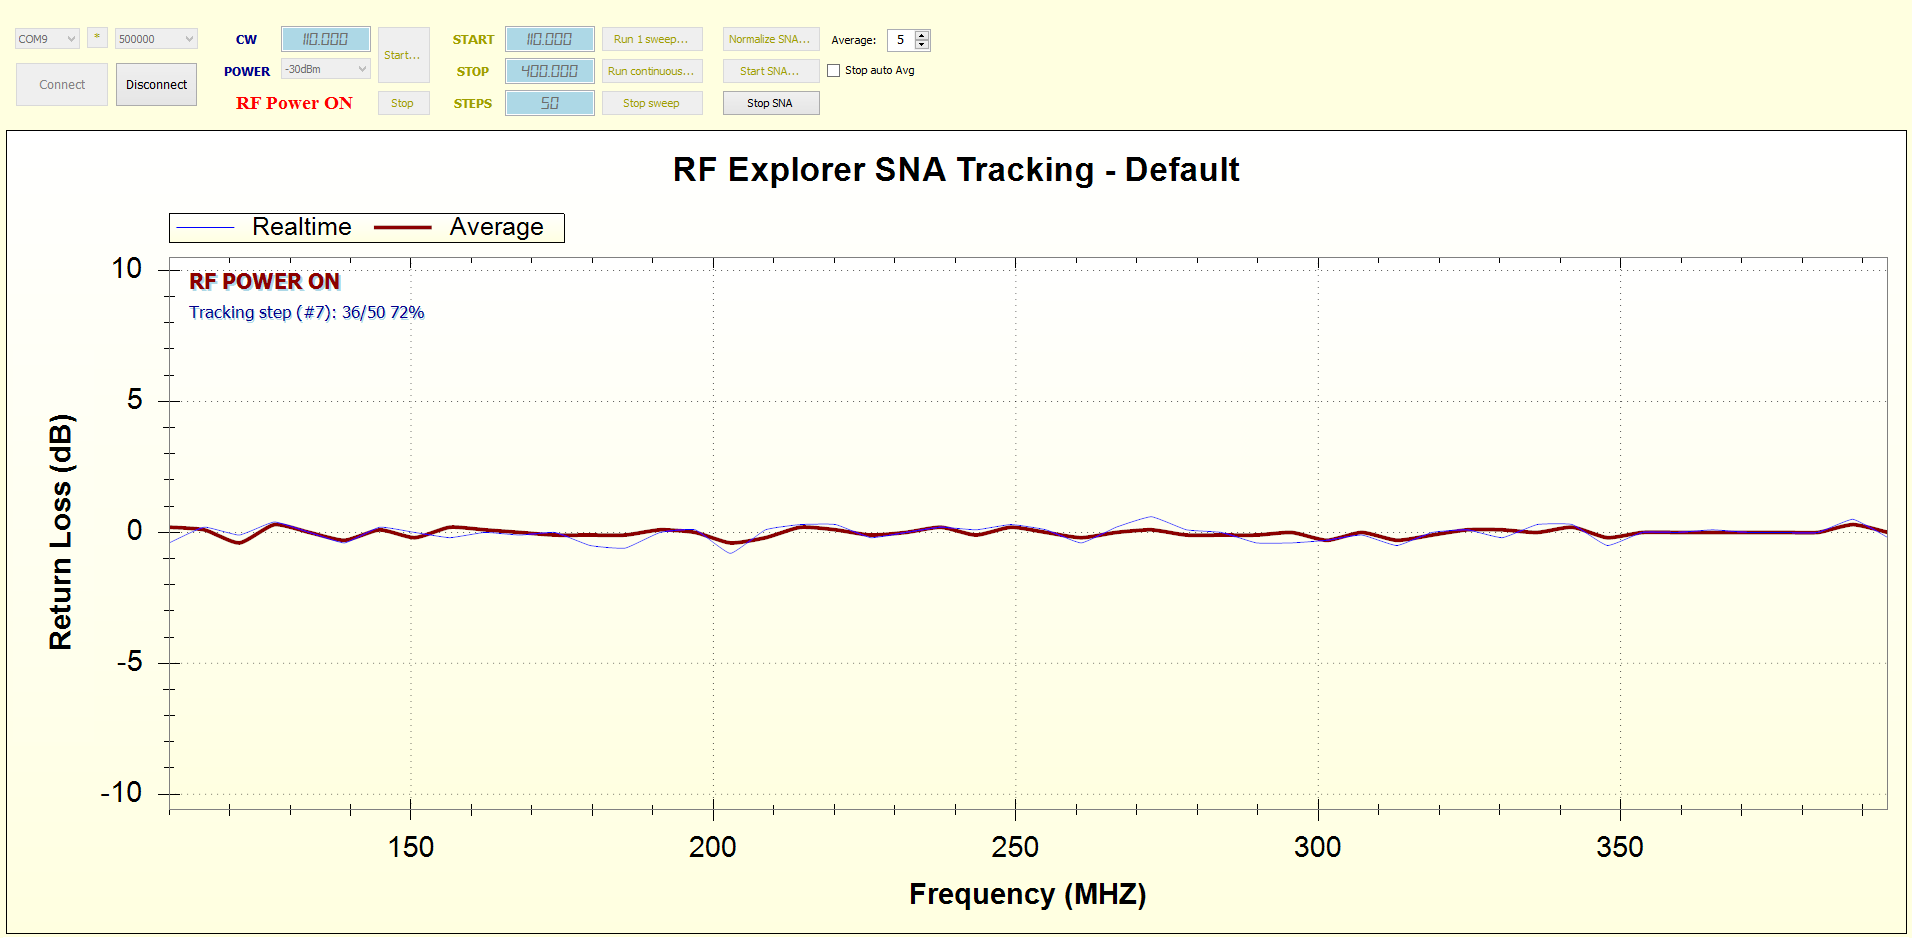
To confirm the normalization works as expected, click on [Start SNA…] button using the same connections, you should see an almost flat line, with small noise like the graph below, usually in the range of +-0.5dB or less.
Measuring reflection for an antenna
An antenna is a 1-port device and therefore easy to connect. And that is the only easy thing we can say about measuring reflection in an antenna.
As a matter of fact, antennas are very tricky devices because while it is being measured, is influenced by all sort of items in the environment:
- External unintended RF sources will interfere with measurements, as the antenna is receiving at all times
- Walls and metallic objects will produce external reflection which are bounced back to the antenna while the SNA is performing measurement, distorting performance
- Most antennas, such as monopole and dipoles, are influenced by ground. An antenna designed for a handheld 2-way radio, for instance, is adjusted for best performance when a human is holding it on his/her hand and, therefore, connected to a bench setup will not be the exact same environment where it is expected to work best.
Due to all this, high precision antenna measurements must be done in special RF chambers, where all external and internal radiations are dramatically reduced.
For most users, an anechoic RF chamber is not available and so only imperfect measurements can be done. That said, the closer we get to an environment where the antenna is expected to work in real life, the better. Keep it far from metallic objects, set it vertical with the help of a good semi rigid RF cable, and minimize external RF sources as much as possible (don’t measure antennas any close to your cell phone, WiFi AP, etc).
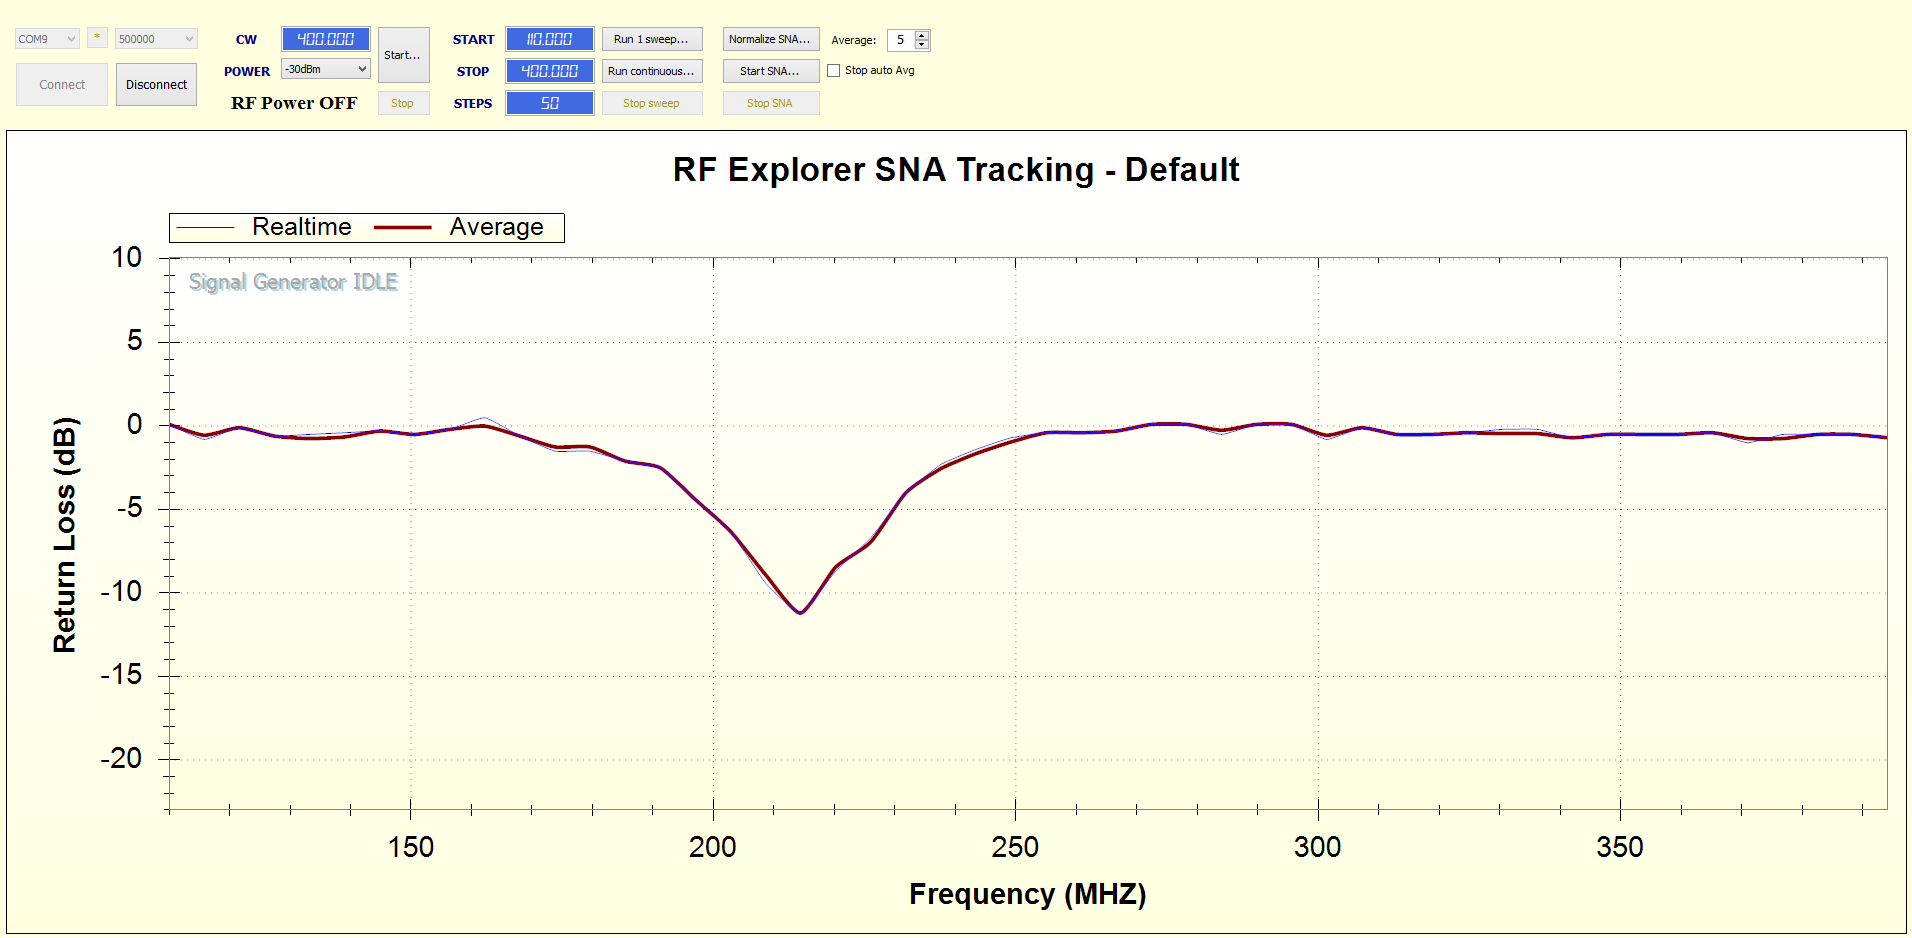
Connect the antenna to the coupler INPUT port, and click on [Start SNA…]
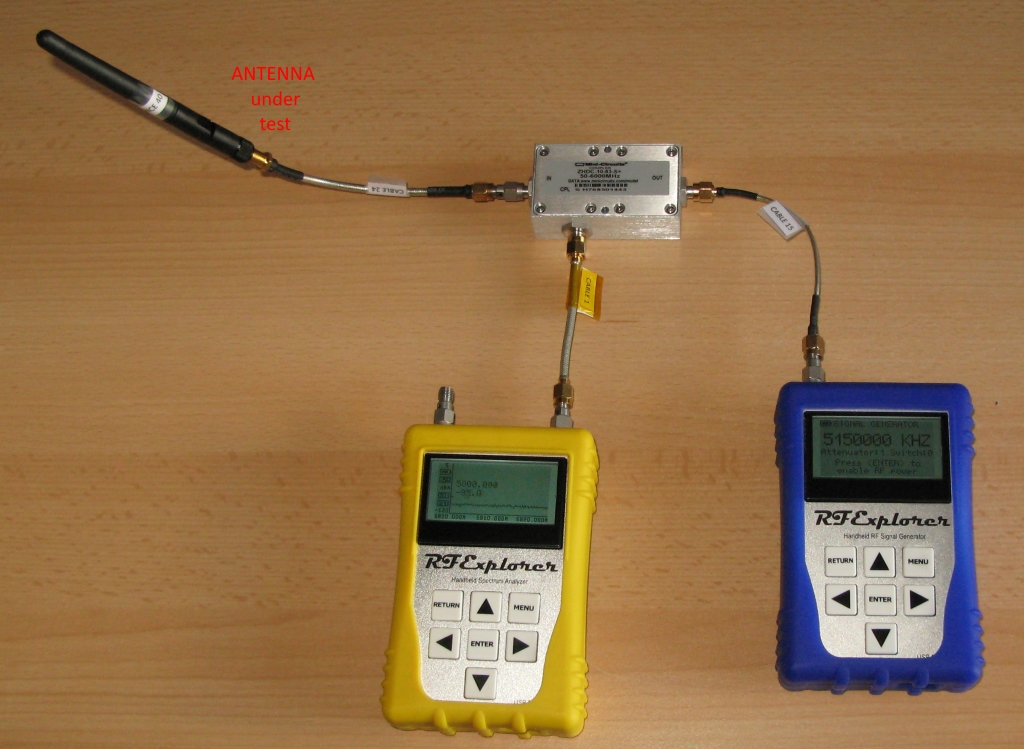
An example of the connection and graph for a 216MHz antenna is shown below.
Measuring reflection of a LPF
Filters are easier to measure than an antenna but, being 2-port devices, is important to remember it must be correctly terminated. In other words, one of the filter ports must be connected to a SMA 50ohm load, and the other port used for reflection measurement.
In RF terminology, one filter port is 1 (input) and the other is 2 (output). Most filters are bidirectional and therefore port 1 and 2 are expected to work the same. When you terminate port 2 with a load and measure port 1, the resulting measurement is S11 return loss. By doing otherwise, you measure S22. Most filters will exhibit S11 and S22 identical responses, so there is no real need to measure response on both ports except if trying to find problems in a faulty filter.
Below is a sketch of all items you need to first normalize, then measure your filter
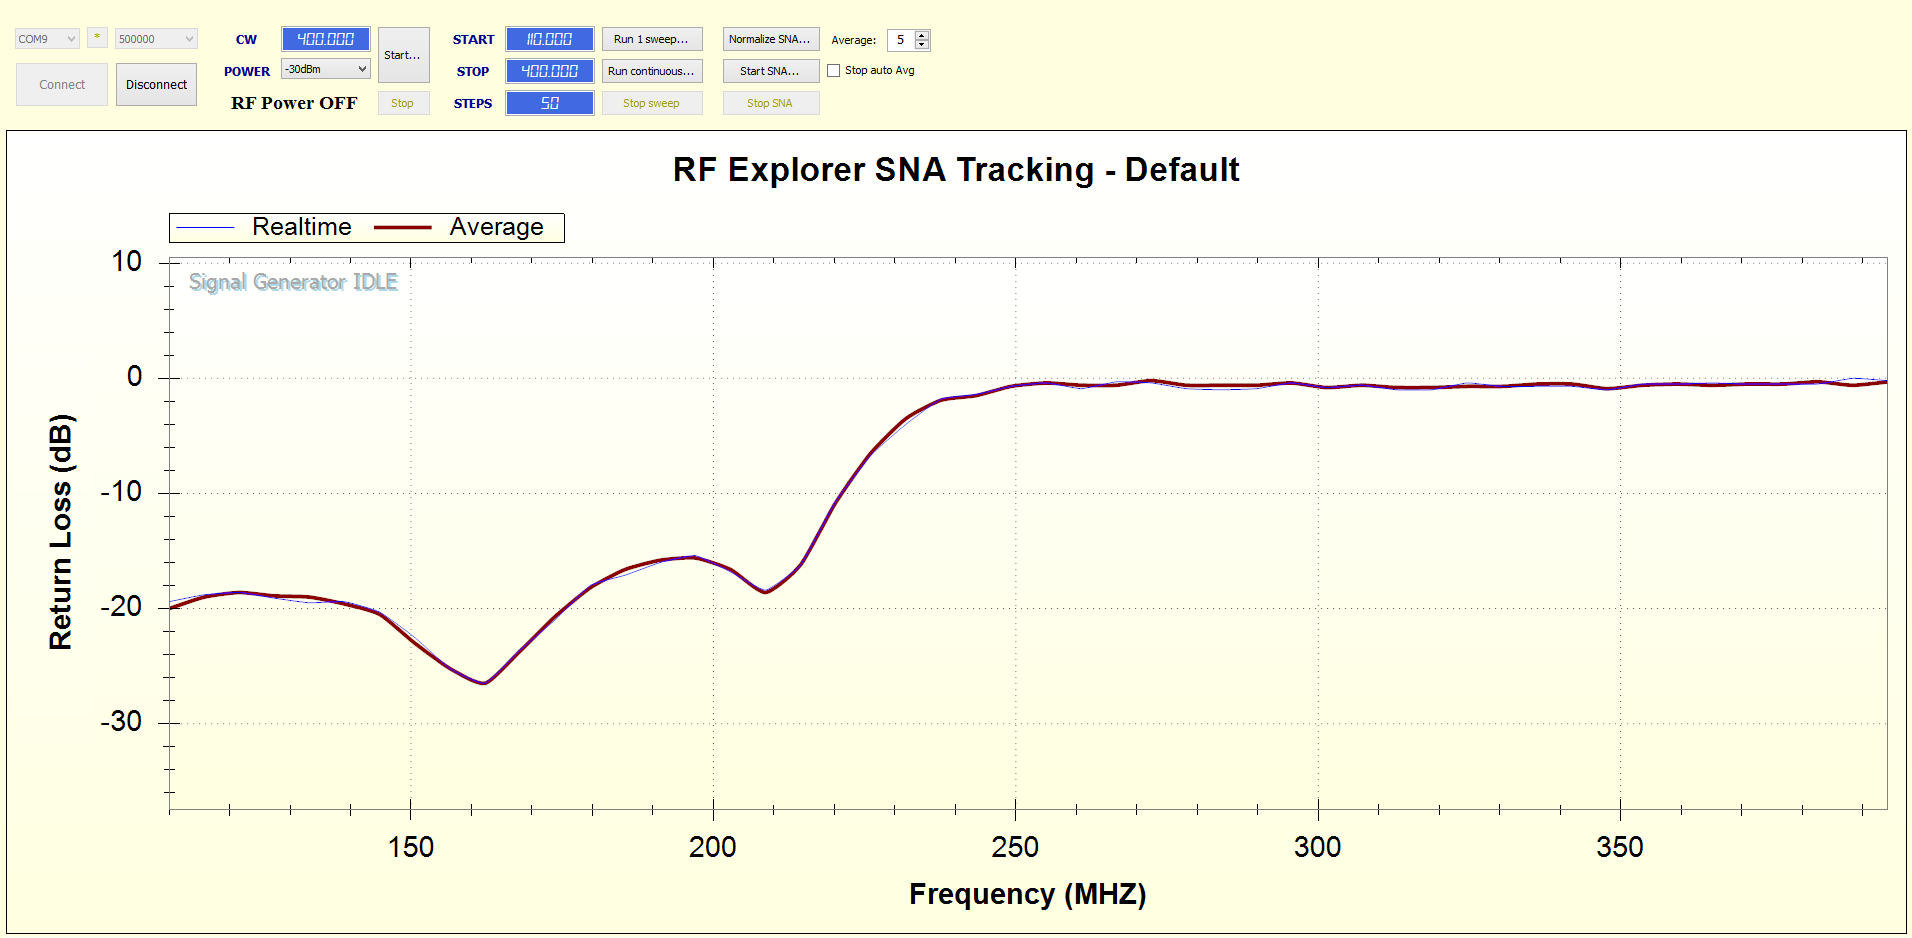
Connect the filter (terminated with 50ohm load) to the coupler INPUT port, and click on [Start SNA…]
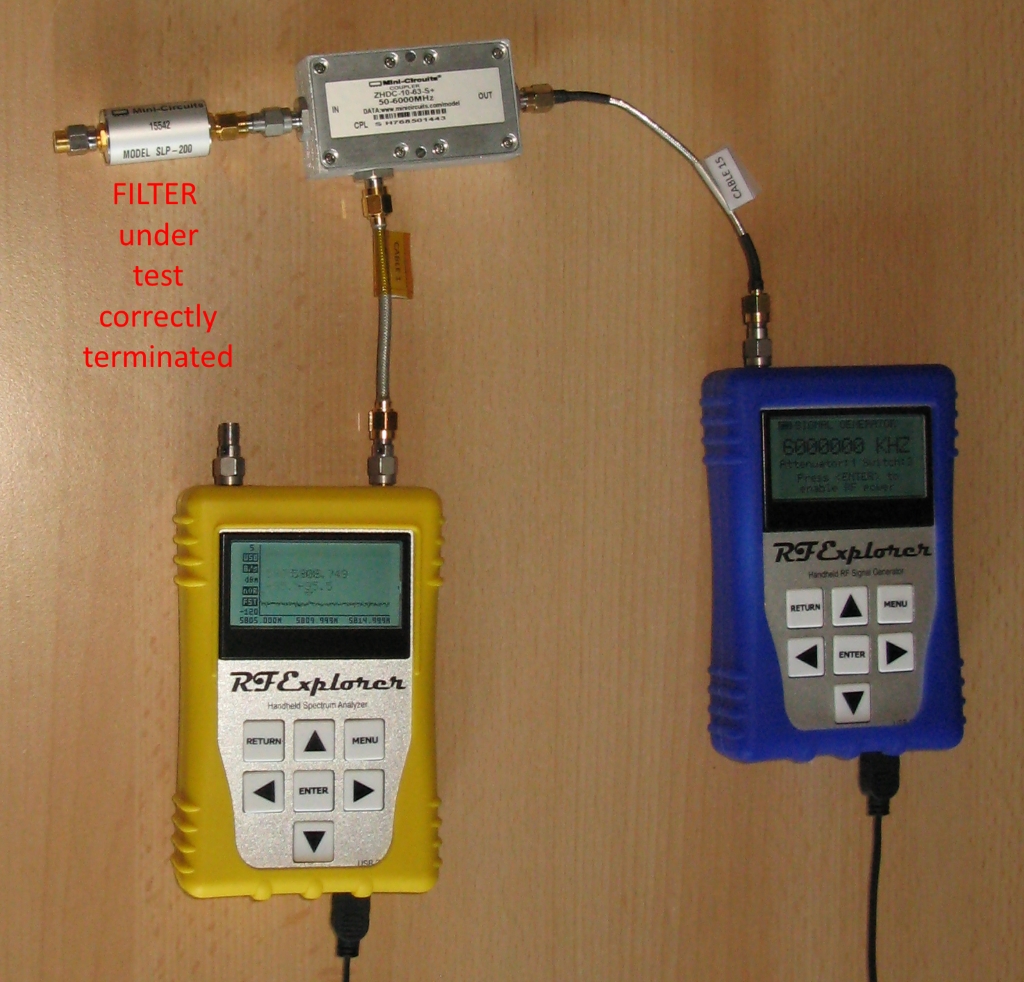
An example of the connection and graph for a 200MHz LPF is shown below.
5 minutes video tutorial
This video tutorial is only 5 minutes long and drives you through the steps required to measure VSWR of a 800MHz antenna.
Video Best viewed in HD 1920x1080 full screen
Additional notes and special cases
- For additional options on Directional Couplers we have tested in our lab, please check this article How-to: Measure Directivity of Directional Couplers
- The connections proposed are correct for general purpose Directional Couplers. However, couplers designed specifically as SWR Bridge or Reflection Bridge have different port labels. Please check this article How-to: Measure Directivity of Directional Couplers for more details.