
RF Explorer Touch User Manual updated to version 2.7

Main menu
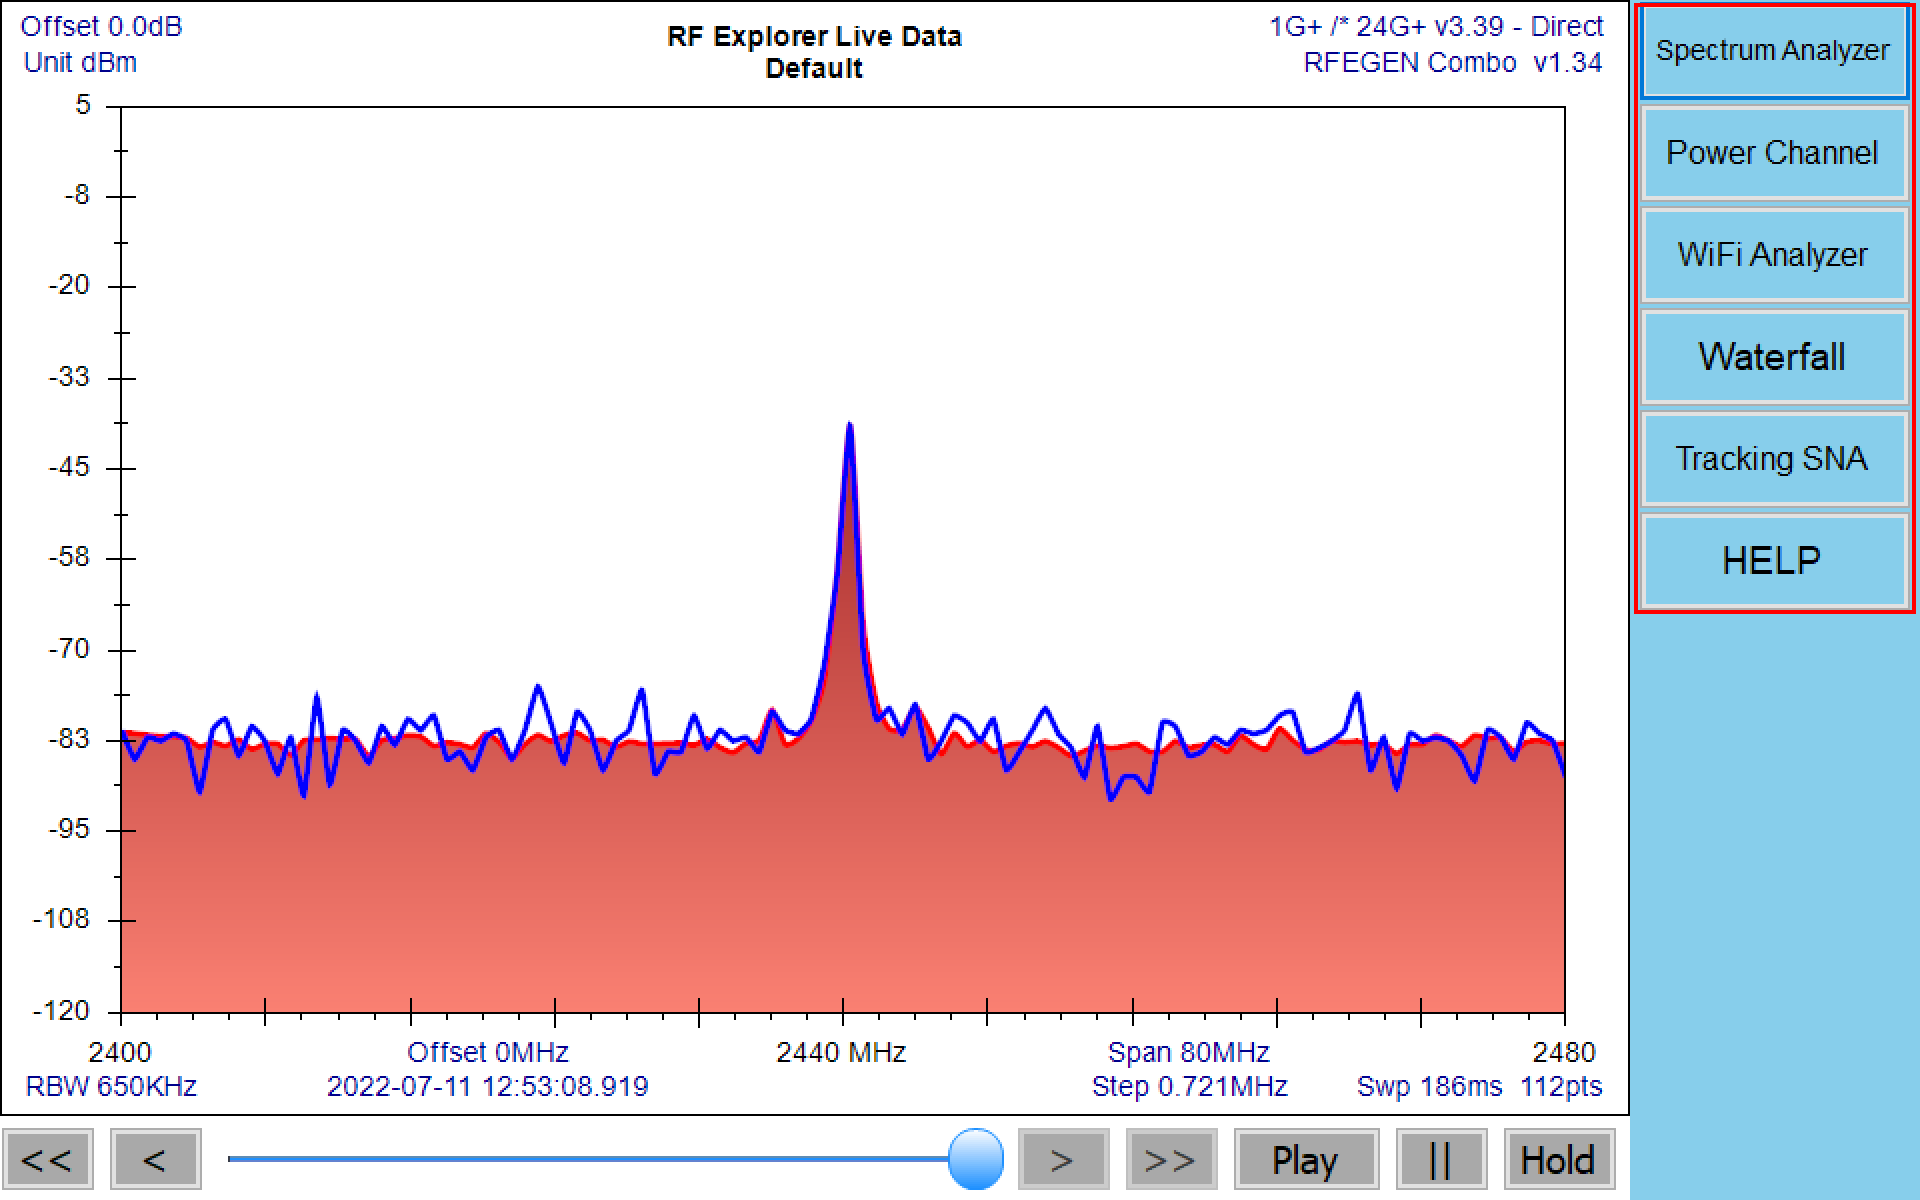
The main menu is designed in a easy to use, hierarchical layout on the right-side of the device screen as depicted in below screen.
Use this menu option to choose between different operational mode such as Spectrum Analyzer, Power Channel, Waterfall or, for models supported, WiFi Analyzer.
Also Tracking SNA mode available if both RF Explorer Spectrum Analyzer and Signal Generator connected at the same time.
Spectrum Analyzer mode is the enabled by default upon application start.
Note
The described menu refers to the Spectrum Analyzer mode. It may change depending on the current working mode. Some options are common to all modes.
The mode-specific options are described in the corresponding section and are remarked inside button option with mode abbreviation in the bottom right corner such as SNA for Tracking SNA mode as depicted below.
Note
The Spectrum Analyzer mode not specific its abbreviation inside options.
Operational Modes
Use this menu option to choose between different operational modes.
Standard configuration to display sweep data Spectrum Analyzer graph.
For more details see:
Note
Spectrum Analyzer mode is the enabled by default upon application start
Spectrum Analyzer mode
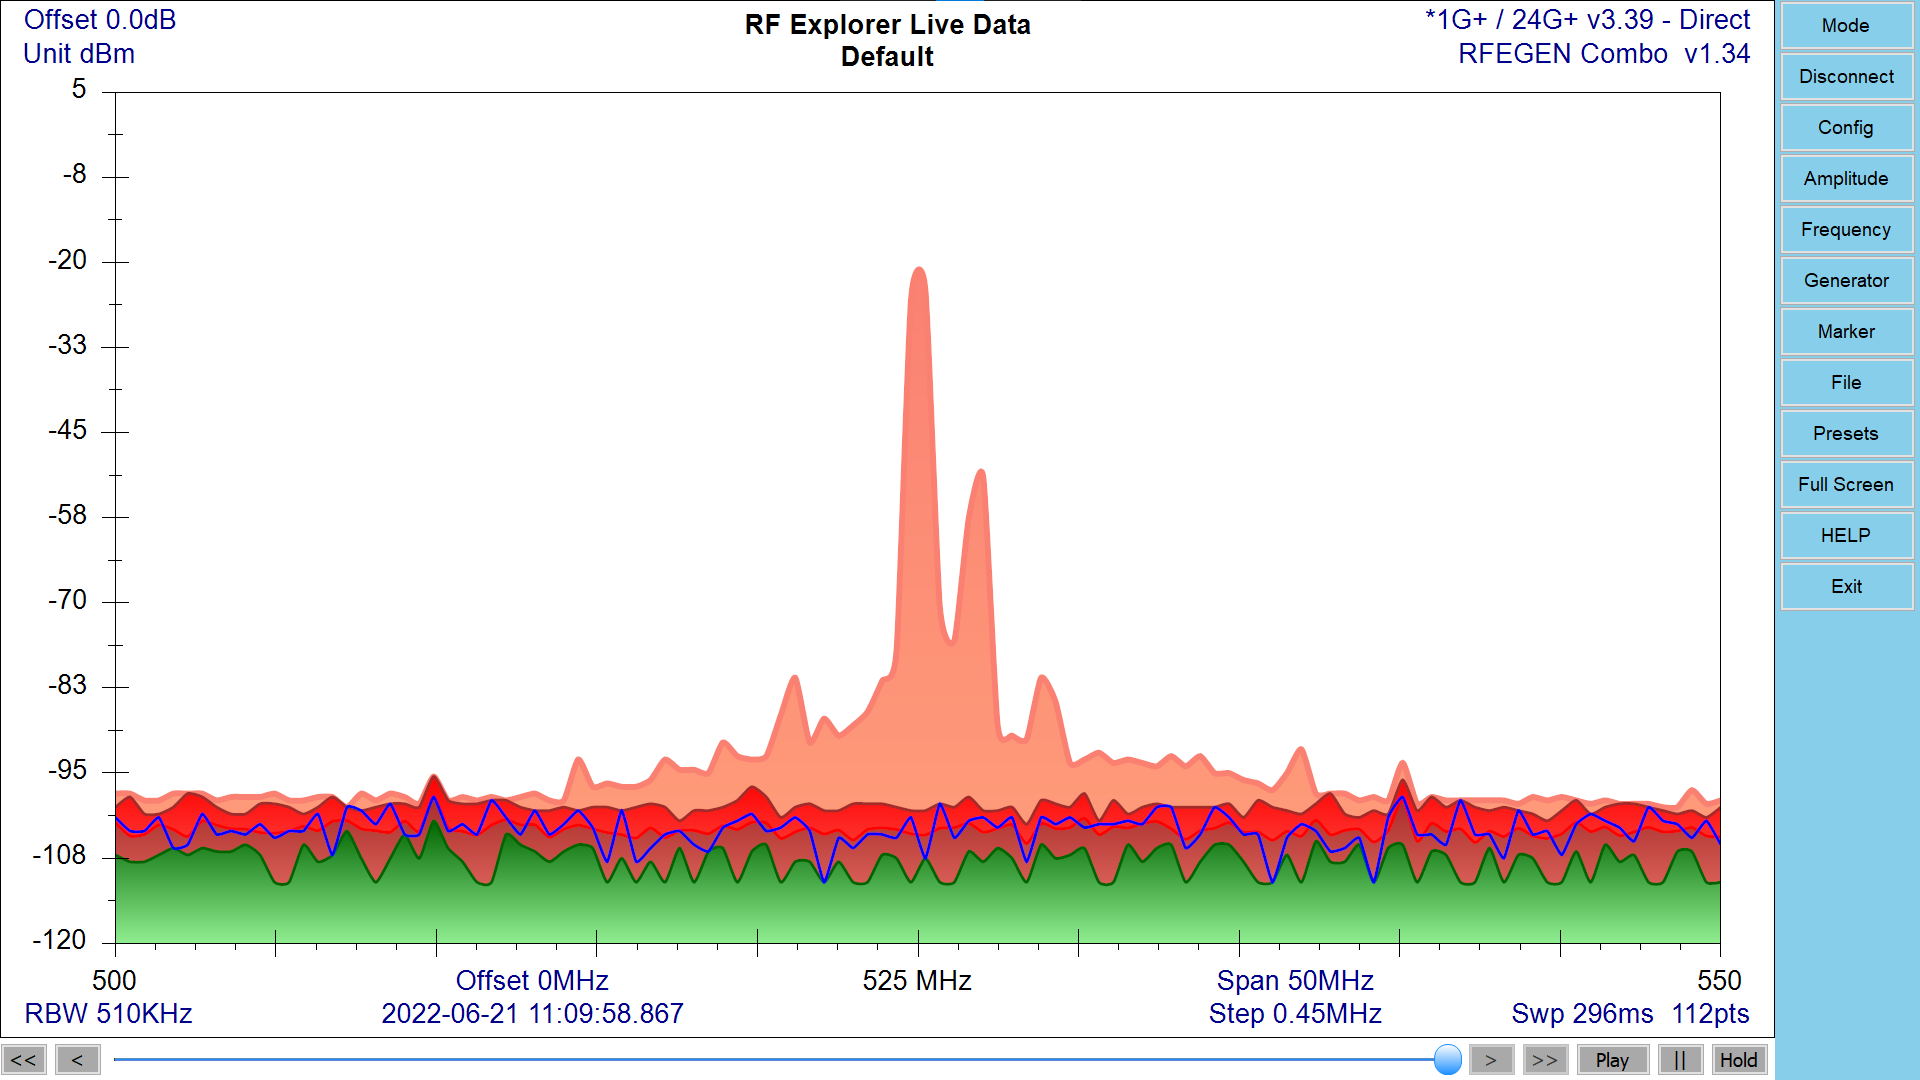
The main screen includes standard spectrum analyzer graph with captured data from RF Explorer handheld analyzer or IoT module and the right-side menu with all options to use the application easily.
The data screen is a high speed data representation of Spectrum Analyzer Frequency vs Amplitude.
The X axis represents frequency in MHZ and Y axis display actual received power in dBm, dBuV or Watt (selectable).
Touch Gestures
You can use two finger gestures to zoom and pan frequency or amplitude.
- Zoom in/out - change Frequency Span: Apply two finger gesture towards the horizontal axis to increase or decrease span.
- Amplitude pan: Move two fingers up or down to pan amplitude
- Frequency pan: Move two fingers left or right to pan frequency
Note
Only supported in Windows platforms with touch gestures capabilities
Navigation and replay sweep control
The navigation bar provides full control to review any past sweep event and also replay sweeps at original captured speed.
This can be used with recently captured data or stored data files.
- [<<]: Go back multiple sweeps (about 10%)
- [ < ]: Go back to previous sweep
- Navigation bar: Point and move to desired sweep. While the scrollbar actuator is being moved, sweep captured date will be updated realtime but spectrum analyzer screen will be updated after releasing the bar.
- [ > ]: Go forward one sweep
- [>>]: Go forward multiple sweeps (about 10%)
- [Play]: Replay captured activity using original captured speed
- [ || ]: Pause spectrum analyzer activity on screen, but the RF Explorer device continues capturing and storing data
- [ Hold ]: Fully stop spectrum analyzer activity and data capture. This is the only valid state when using data from file
- [ Live ]: Restore spectrum analyzer activity and data capture
Hold status

Live status

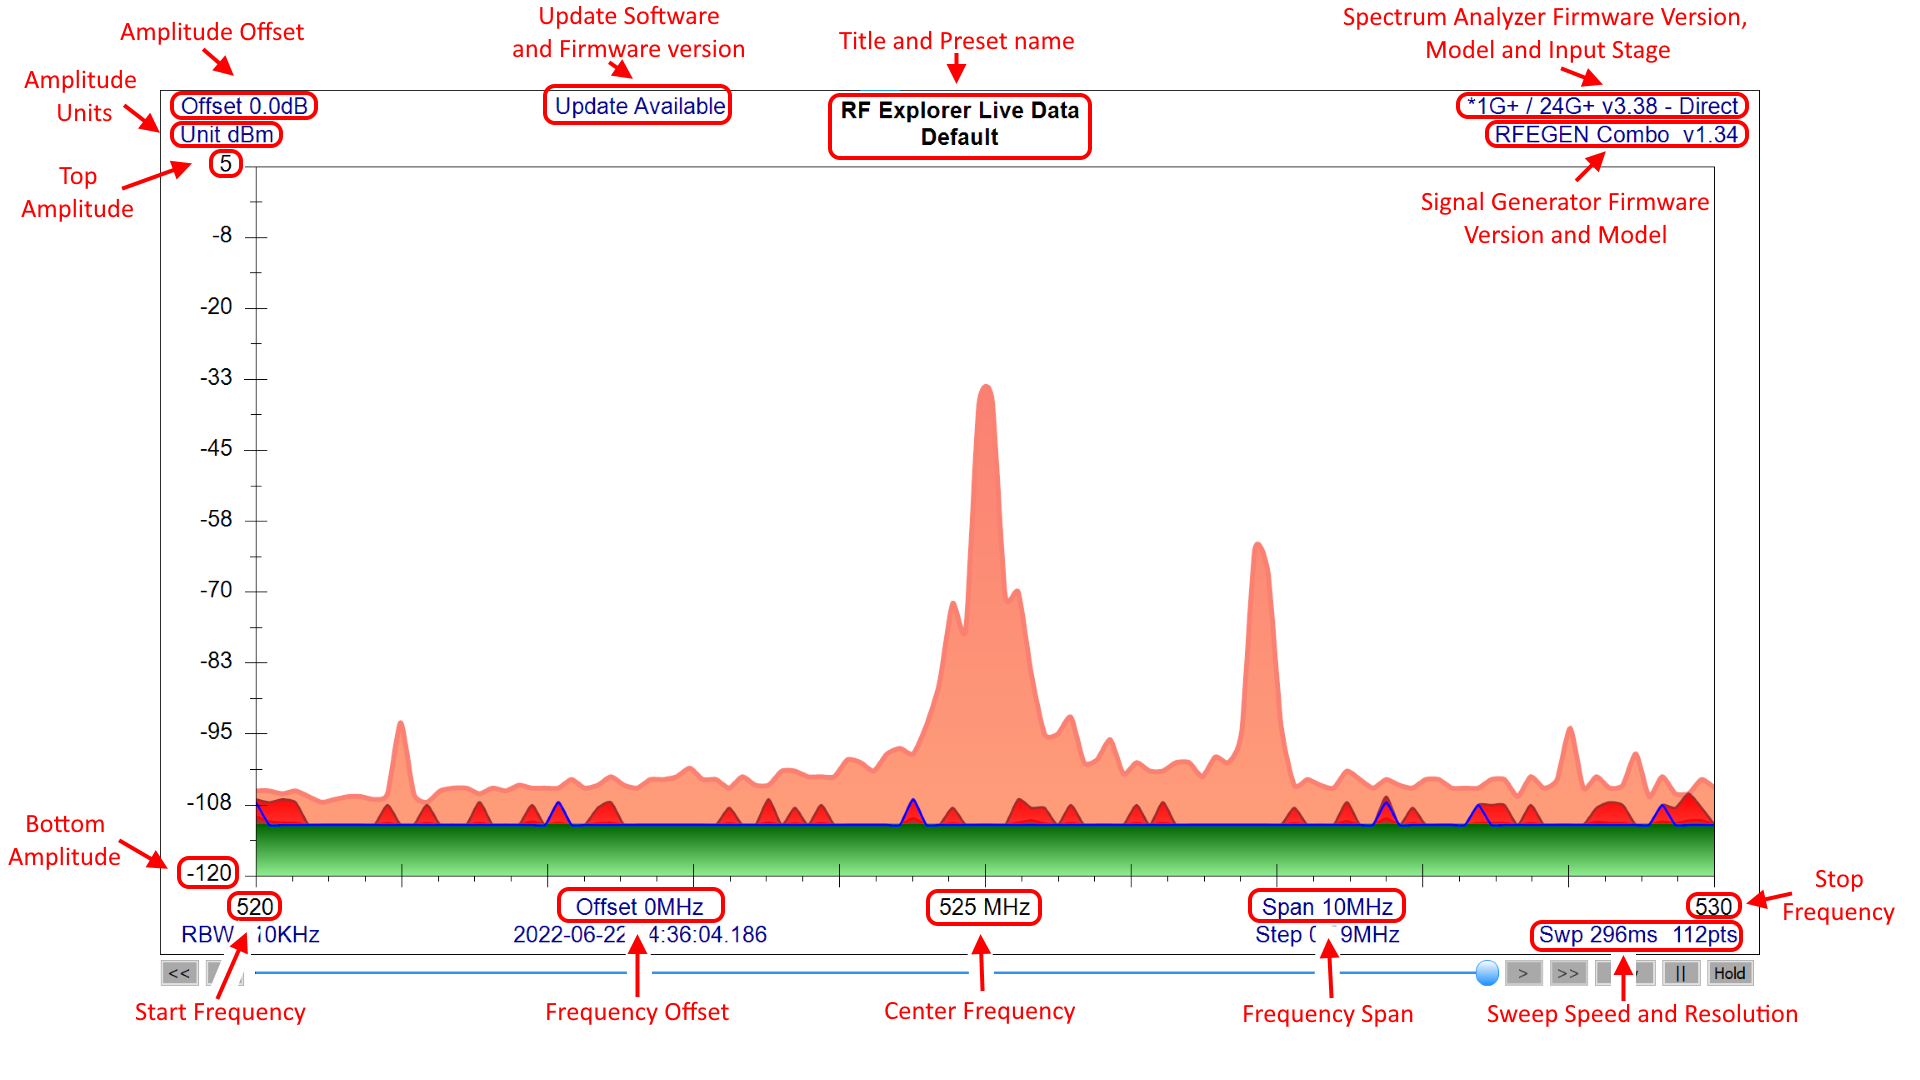
Touch Labels
Some parameters can be easily configured by screen touch or click marked with red areas in picture above.
Press each of these regions to change:
- Amplitude Top/Bottom - Change with numeric dialog
- Start/Center/Stop frequency - Change with numeric dialog
- Graph title - Set current preset. Note this is not available for Full Screen mode
- Amplitude Offset - Change with numeric dialog
- Amplitude Units - Menu Config -> Display
- Spectrum Analyzer Firmware Version, Model and Input Stage - Menu Config -> Device
- Signal Generator Firmware Version and Model - For information purposes only
- Frequency Offset - Change with numeric dialog
- Span Frequency - Change with numeric dialog
- Sweep Resolution - Menu Config -> Device
- Upgrade Available - Update RF Explorer Touch software and device firmware version to the latest one available online.
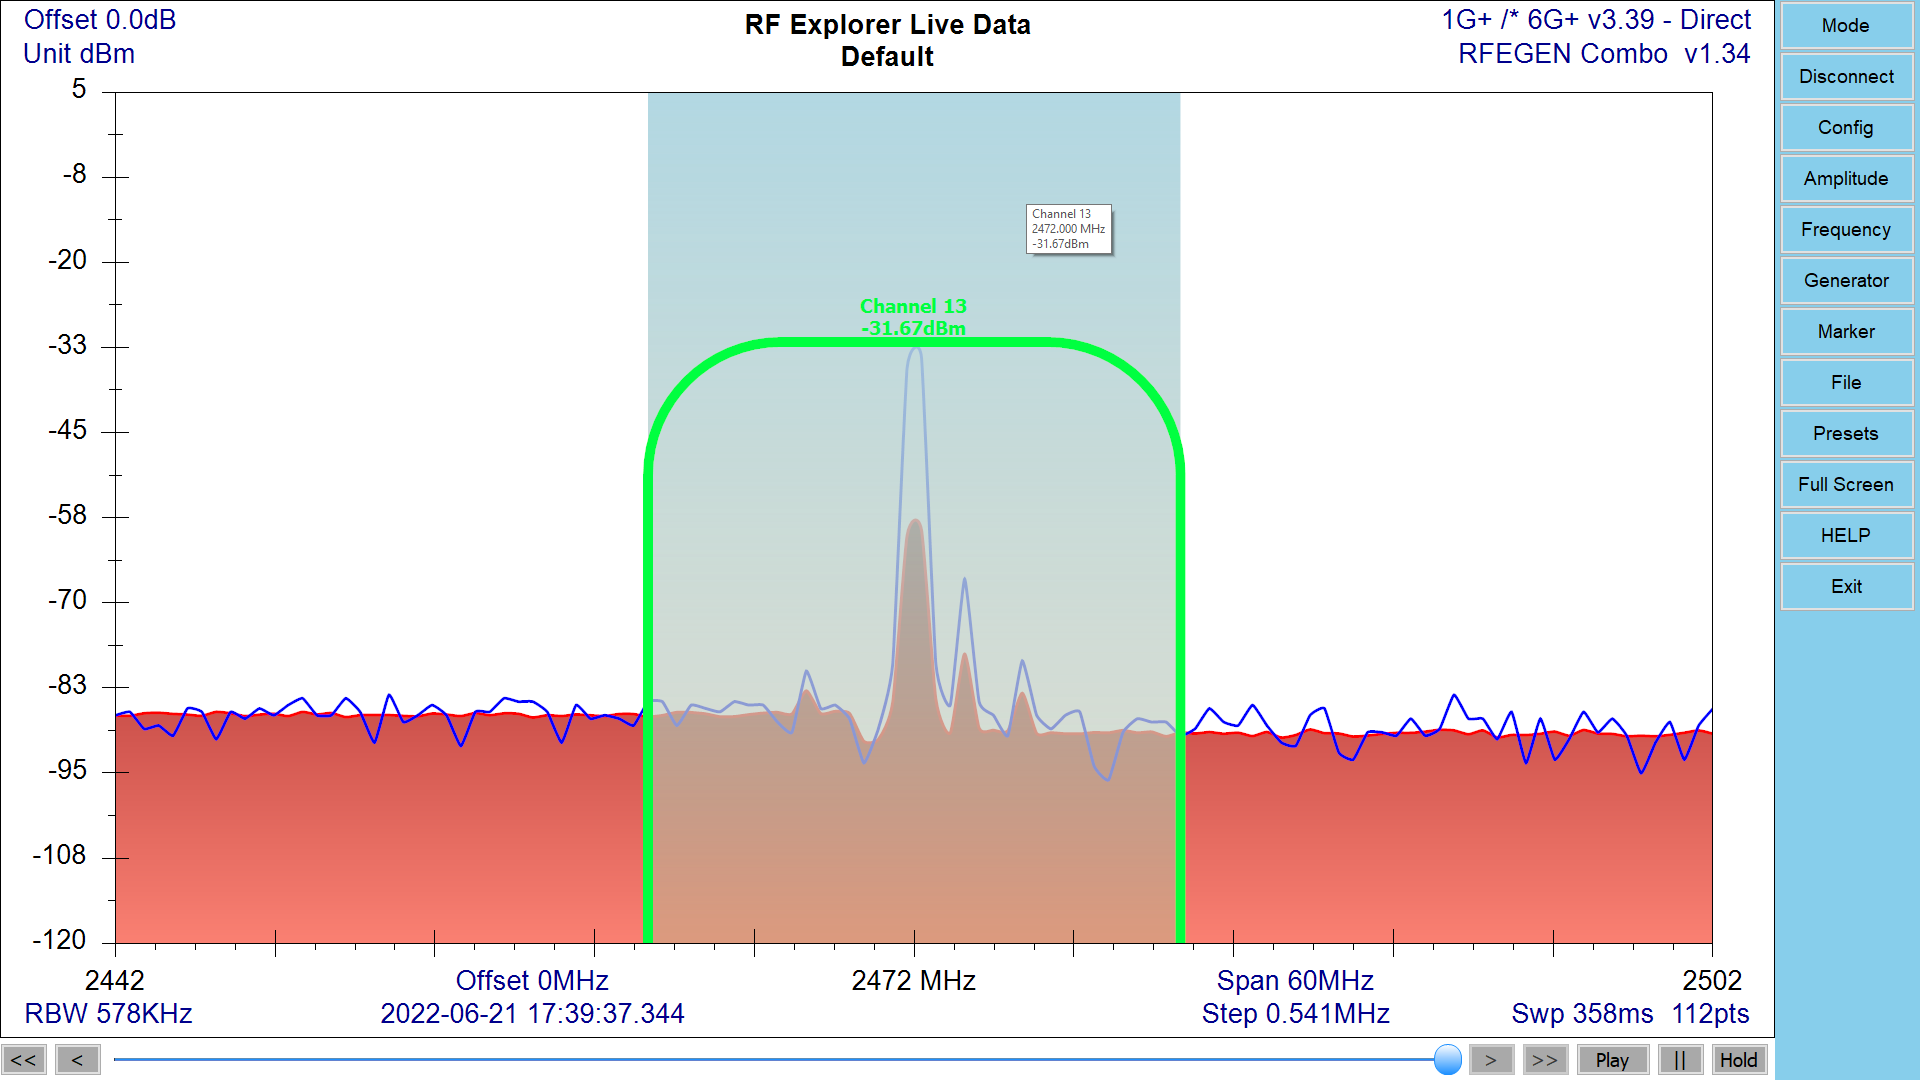
WiFi Analyzer mode
This special mode in the Spectrum Analyzer screen displays WiFi channels for 2.4Ghz and 5GHz - only available in RF Explorer devices supporting the specific frequency range.
RF Explorer PLUS models
Firmware v3.16 or higher is required
RF Explorer Standard models
Firmware v1.31 or higher is required
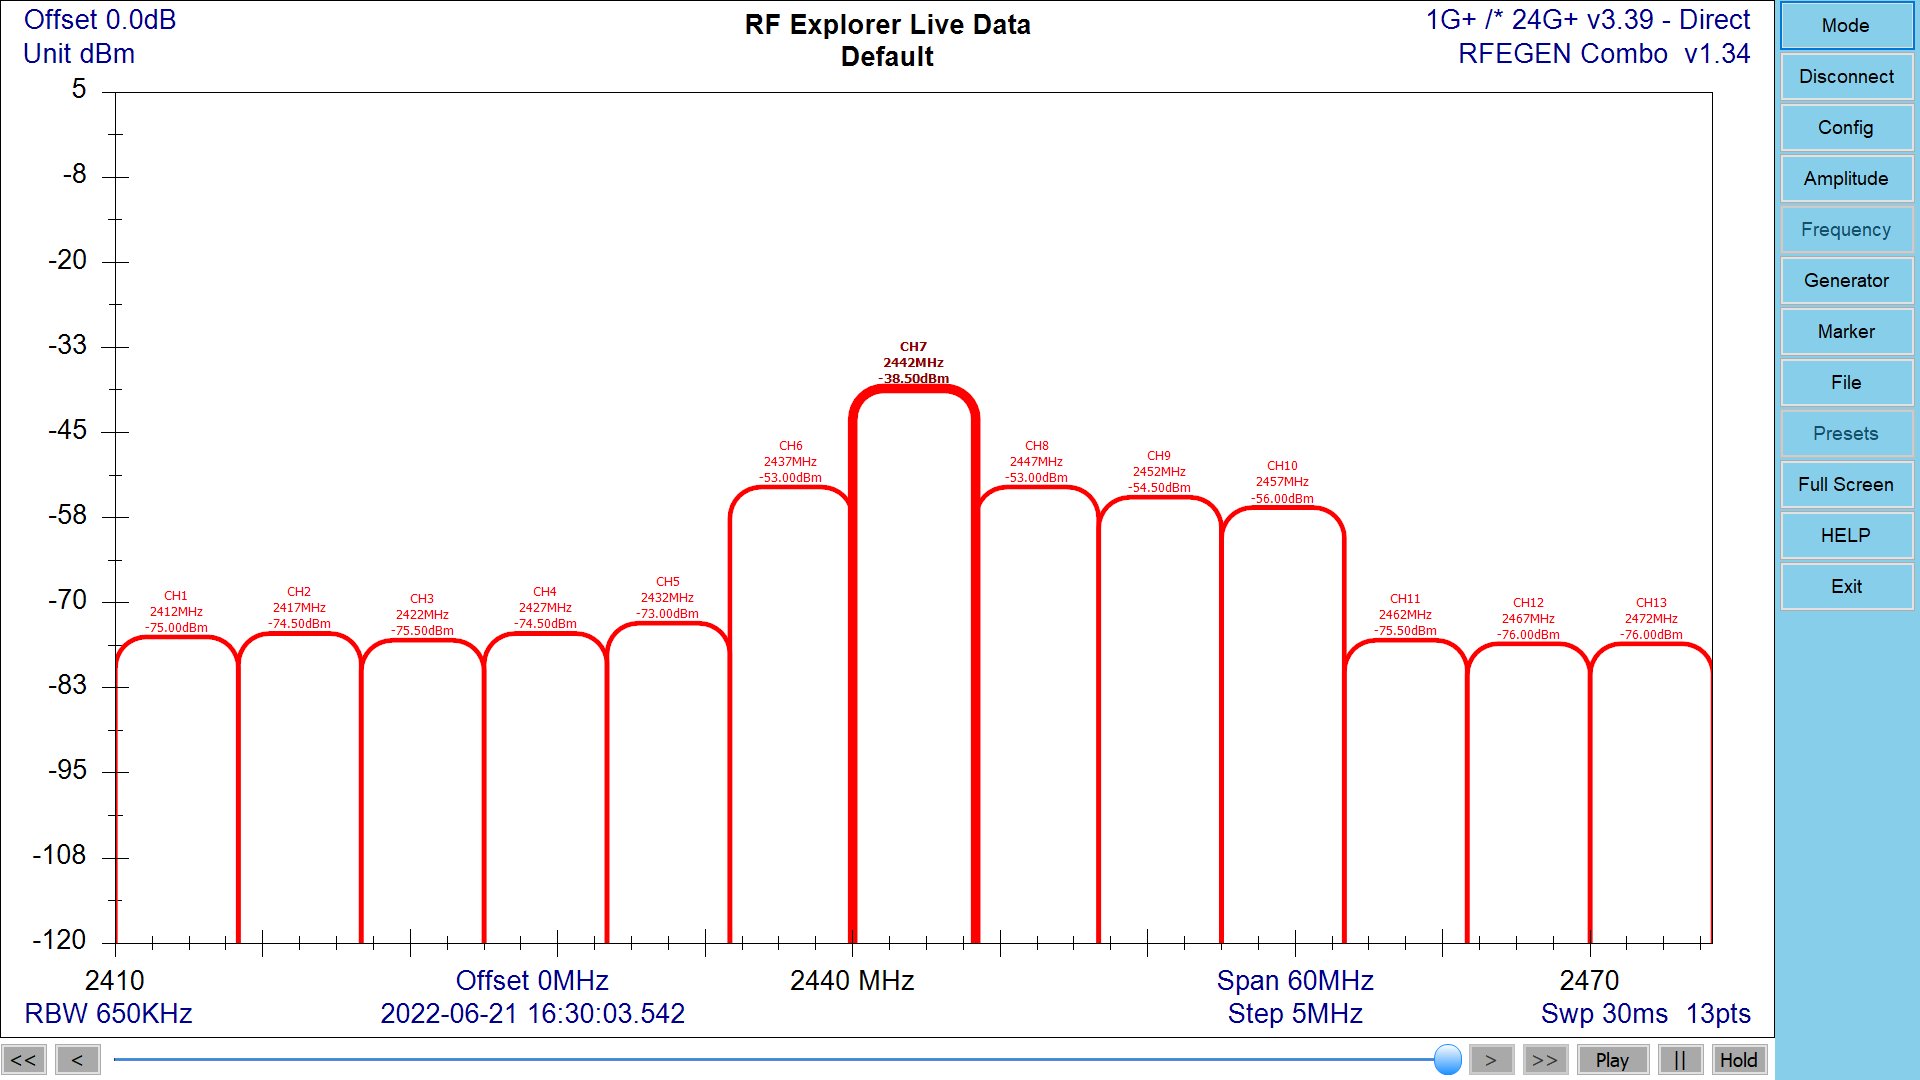
WiFi 2.4GHz Band
Display view for channels 1-13 including center channel frequency and channel power.
The higher power channel detected is depicted in a different color.
Note
2.4GHz channels are actually overlapping by definition, but are displayed in this mode as non-overlapping to simplify visualization.
Overlapping channels display can be configured using Radio Standards.
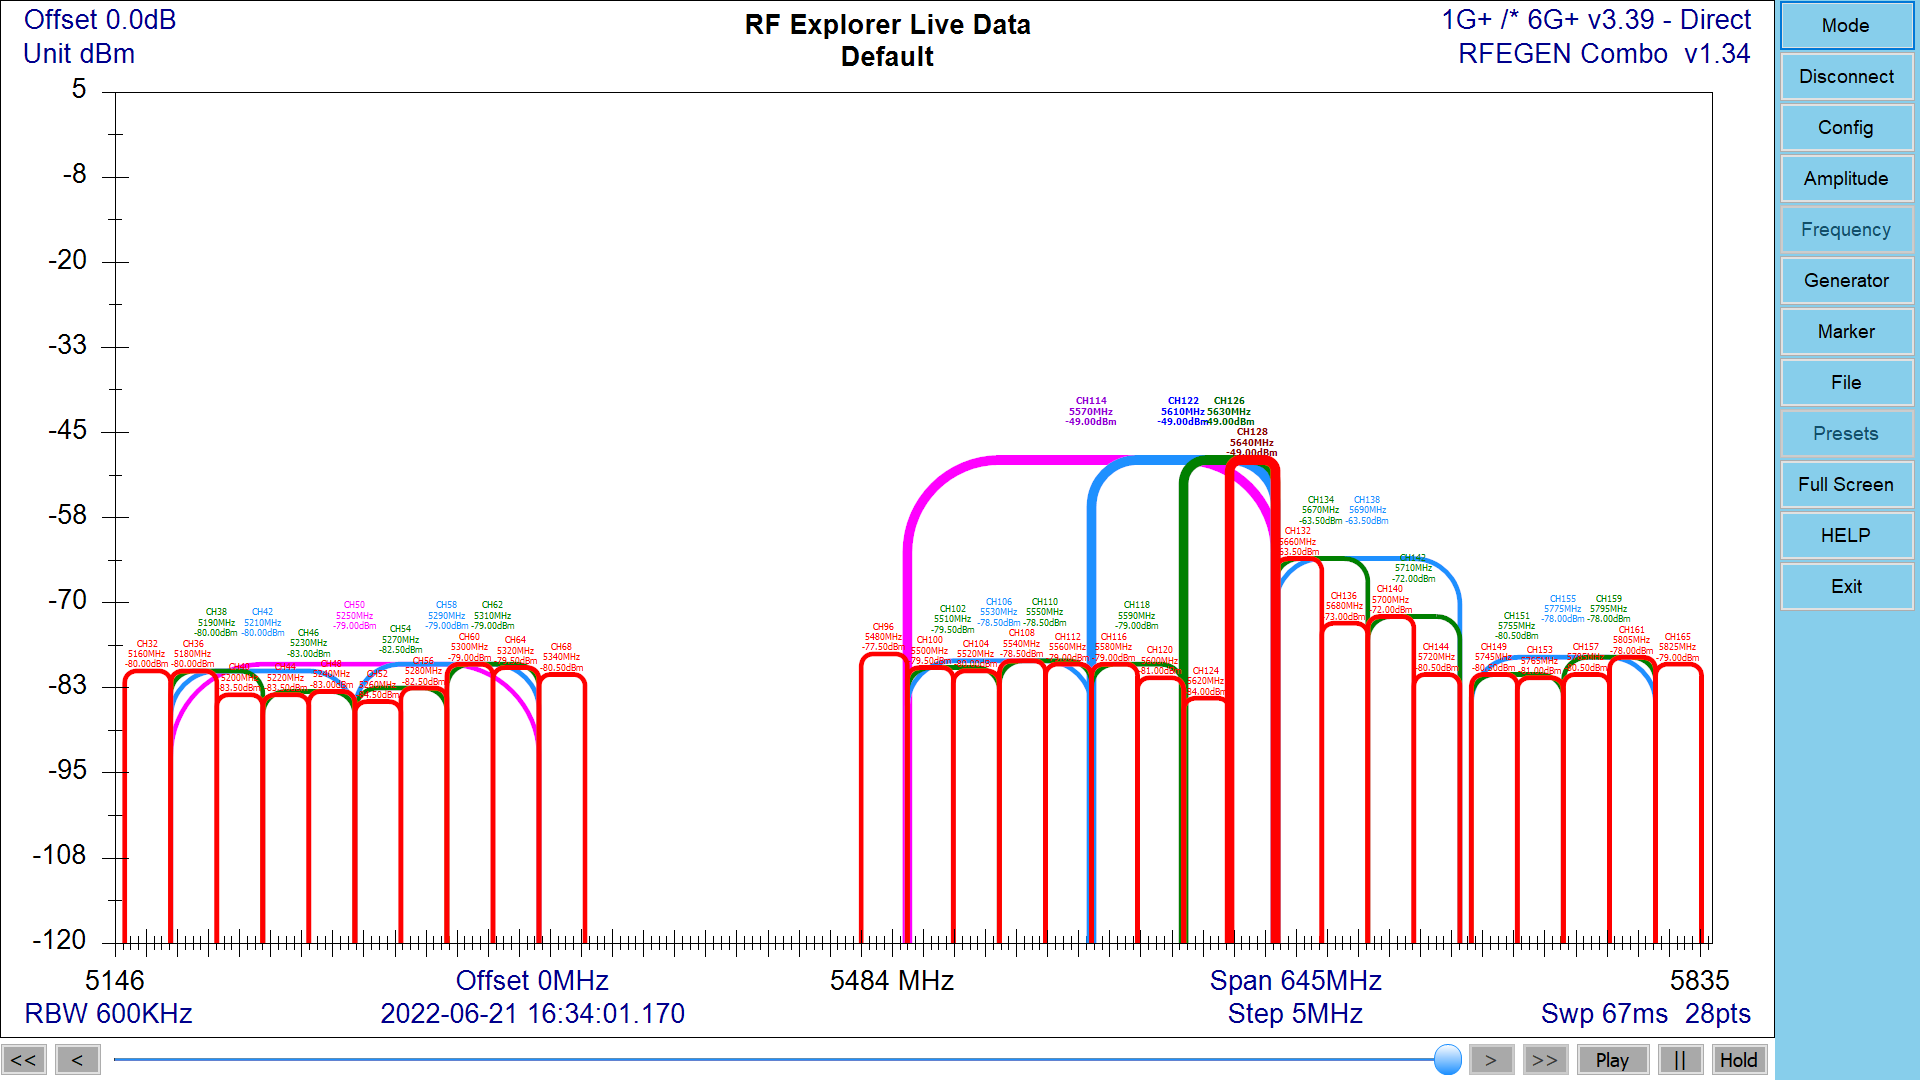
WiFi 5GHz Band
Display view for 28 channels defined for 20MHz width, including center channel frequency and channel power.
On top of 20MHz channels, 40MHz, 80MHz and 160MHz channels are displayed.
- Red - 20MHz channels
- Green - 40MHz channels
- Blue - 80MHz channels
- Magenta - 160MHz channels
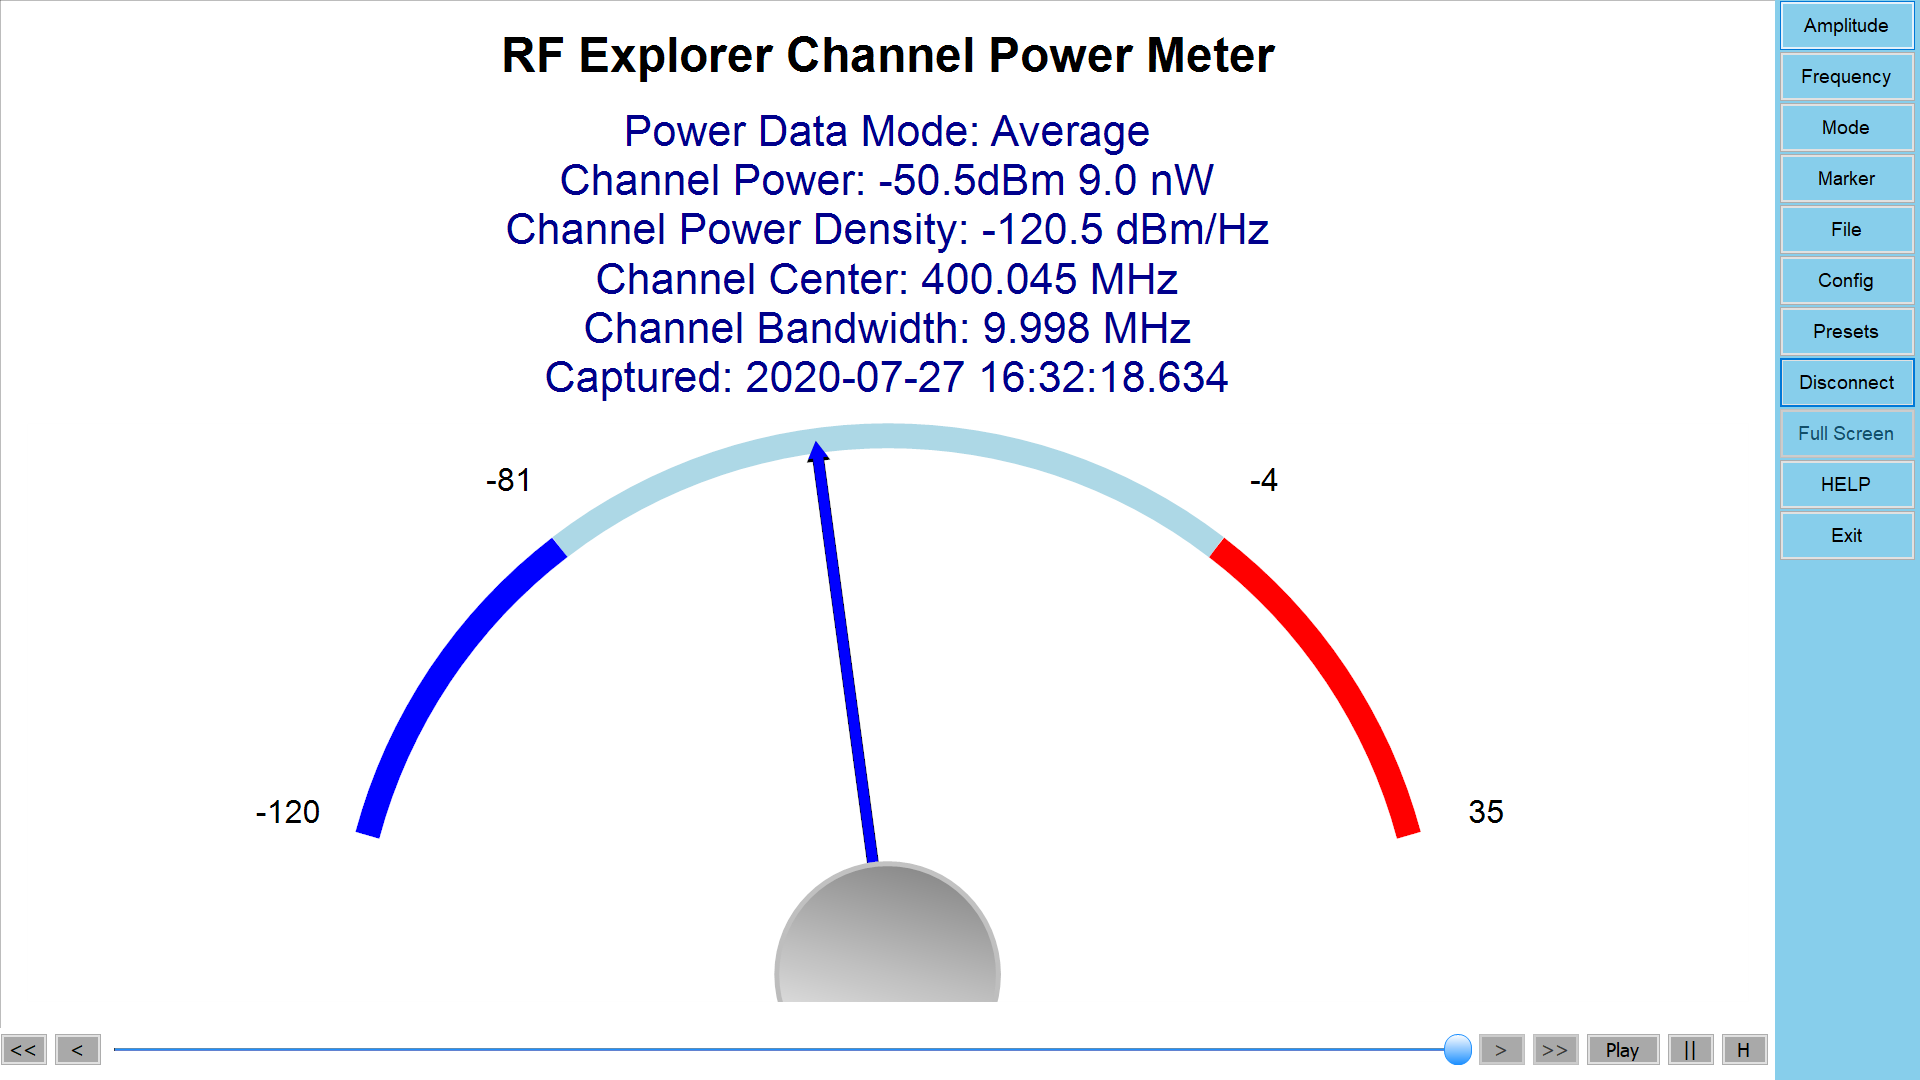
Power Channel mode
Show power measured within channel defined by start/stop frequency.
Power Data Mode
Trace from which measurements are performed.
Channel Power
Power received in the frequency band represented in dBm and Watt units.
Channel Power Density
Represents how the signal power is distributed in dBm/Hz unit.
Channel Center
Center frequency of the channel in MHz unit.
Channel Bandwidth
Bandwidth of the channel in MHz unit.
Captured
Date and time when sweep was captured.
Waterfall mode
OpenGL 3D graphics supported
This is a powerful, high performance 2D/3D visualization of historical sweeps, displaying the most recent captured sweep in front, with older sweeps in the background.
It is a very efficient and practical way to display intermittent or time-changing signals that may not be easy to detect any other way.
Note
This screen is only available for Windows computers at the moment.
This view is not supported in WiFi Analyzer mode.
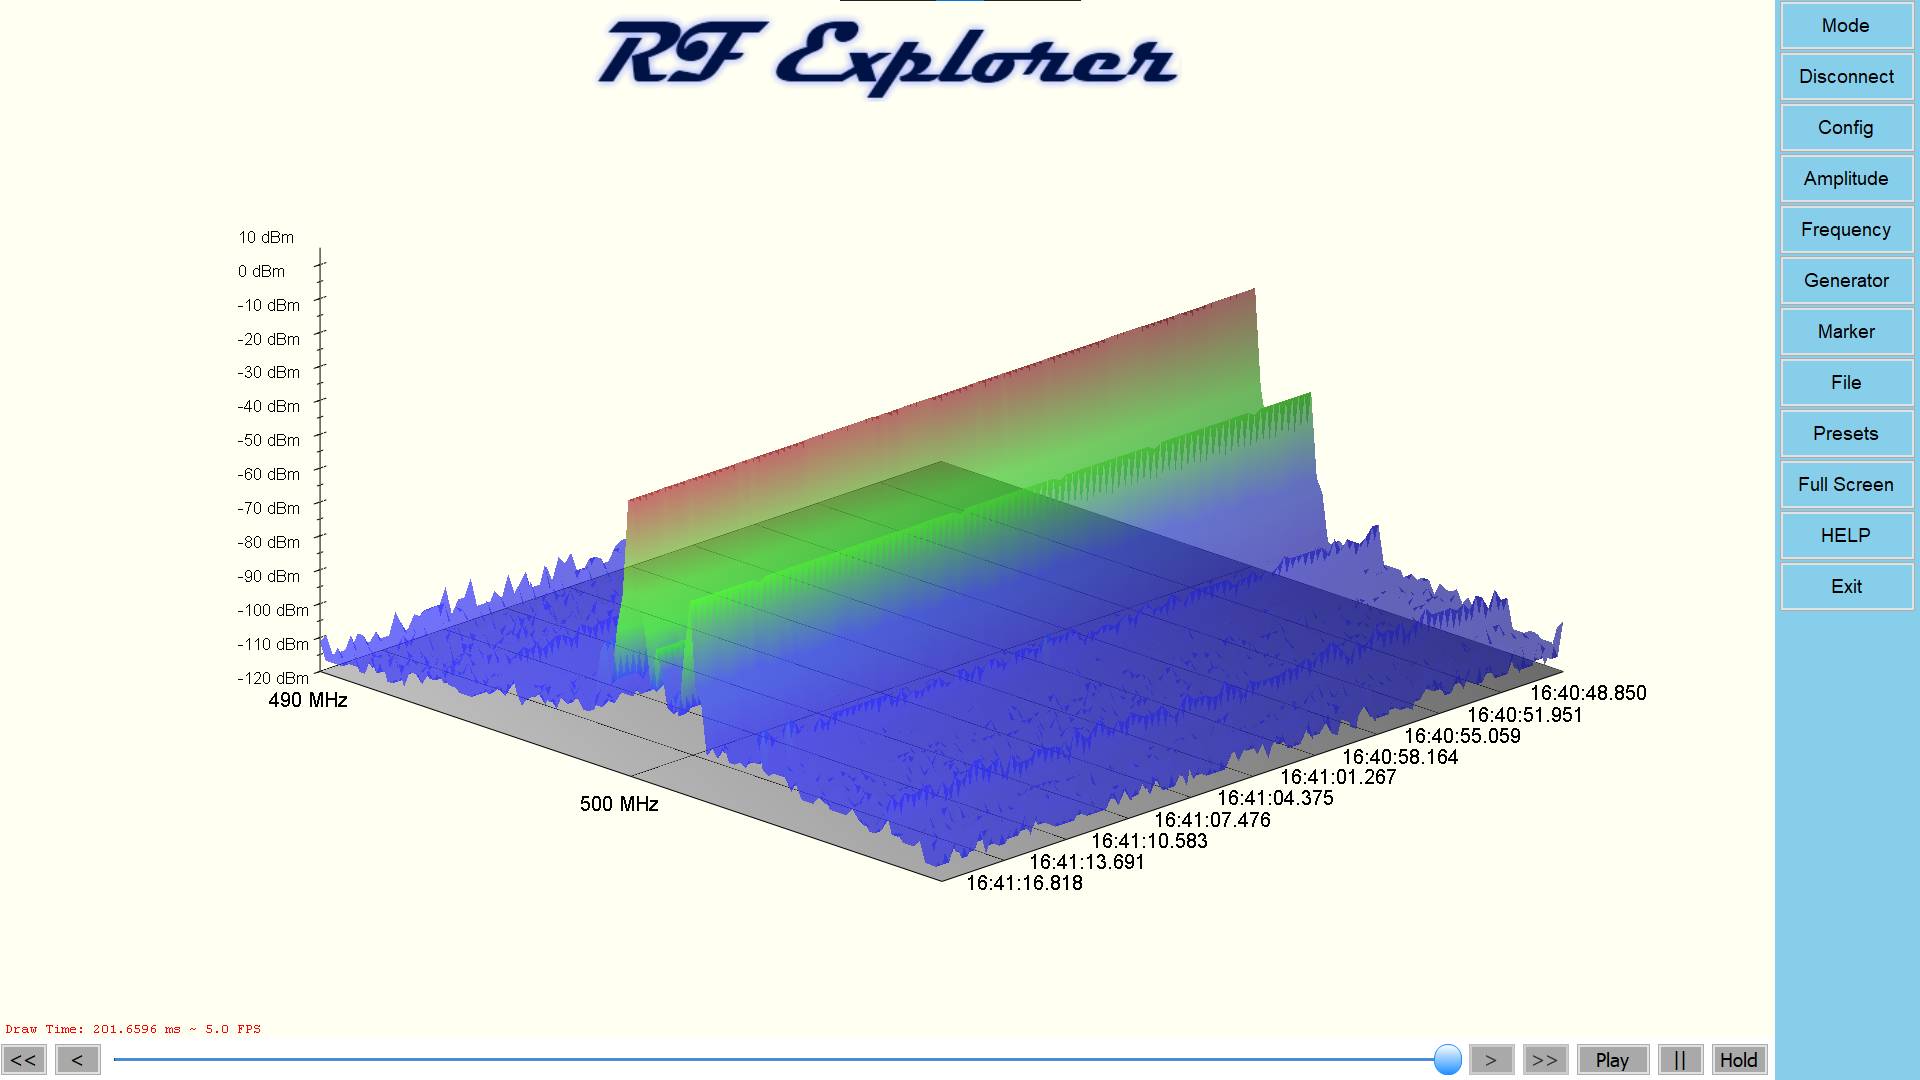
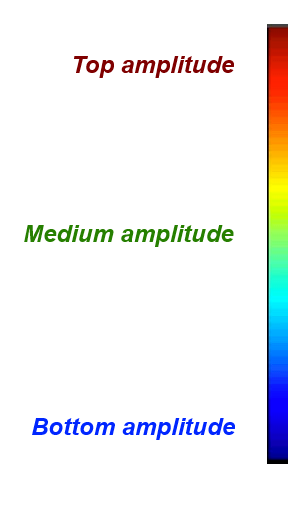
The color map used by the Waterfall screen is defined by the Top and Bottom amplitude signals configured on the spectrum analyzer.
Signal peaks that are close to the top will show red region whereas signals close to the bottom will display blue, with a color gradient in between.
The "heat" of the display color code can be dynamically adjusted by changing the Top and Bottom amplitude settings anytime.
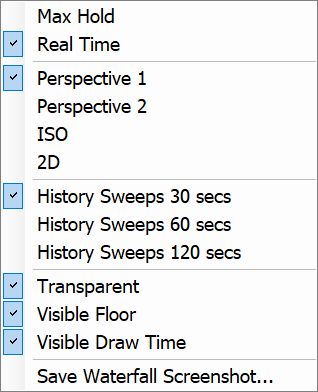
Settings
Right click on the waterfall screen anytime to enable a context sensitive menu.
Signal Type
- Real Time: Show real time captured activity.
- Max Hold: Show maximum value of all captured samples.
Perspective
You can choose between 4 different perspectives, including a 2D view that is best suited for accurate signal research.
History Sweeps Time
Determine historical time to be displayed as last 30, 60 or 120 seconds.
Transparent
Define 3D graphics as transparent when selected, or opaque when unselected.
Visible Floor
Display a gray, opaque grid floor when selected.
Visible Draw Time
Sometimes useful to know the performance of the graphics card representing frames per second (FPS) of the waterfall display.
Save Waterfall Screenshot
Store Waterfall screen to an PNG image file.
Waterfall perspective 2D

Tracking SNA mode
RF Explorer Spectrum Analyzer connected
Notes
Sweep navigation control is not available for replaying sweeps
RealTime and Average are the only available traces
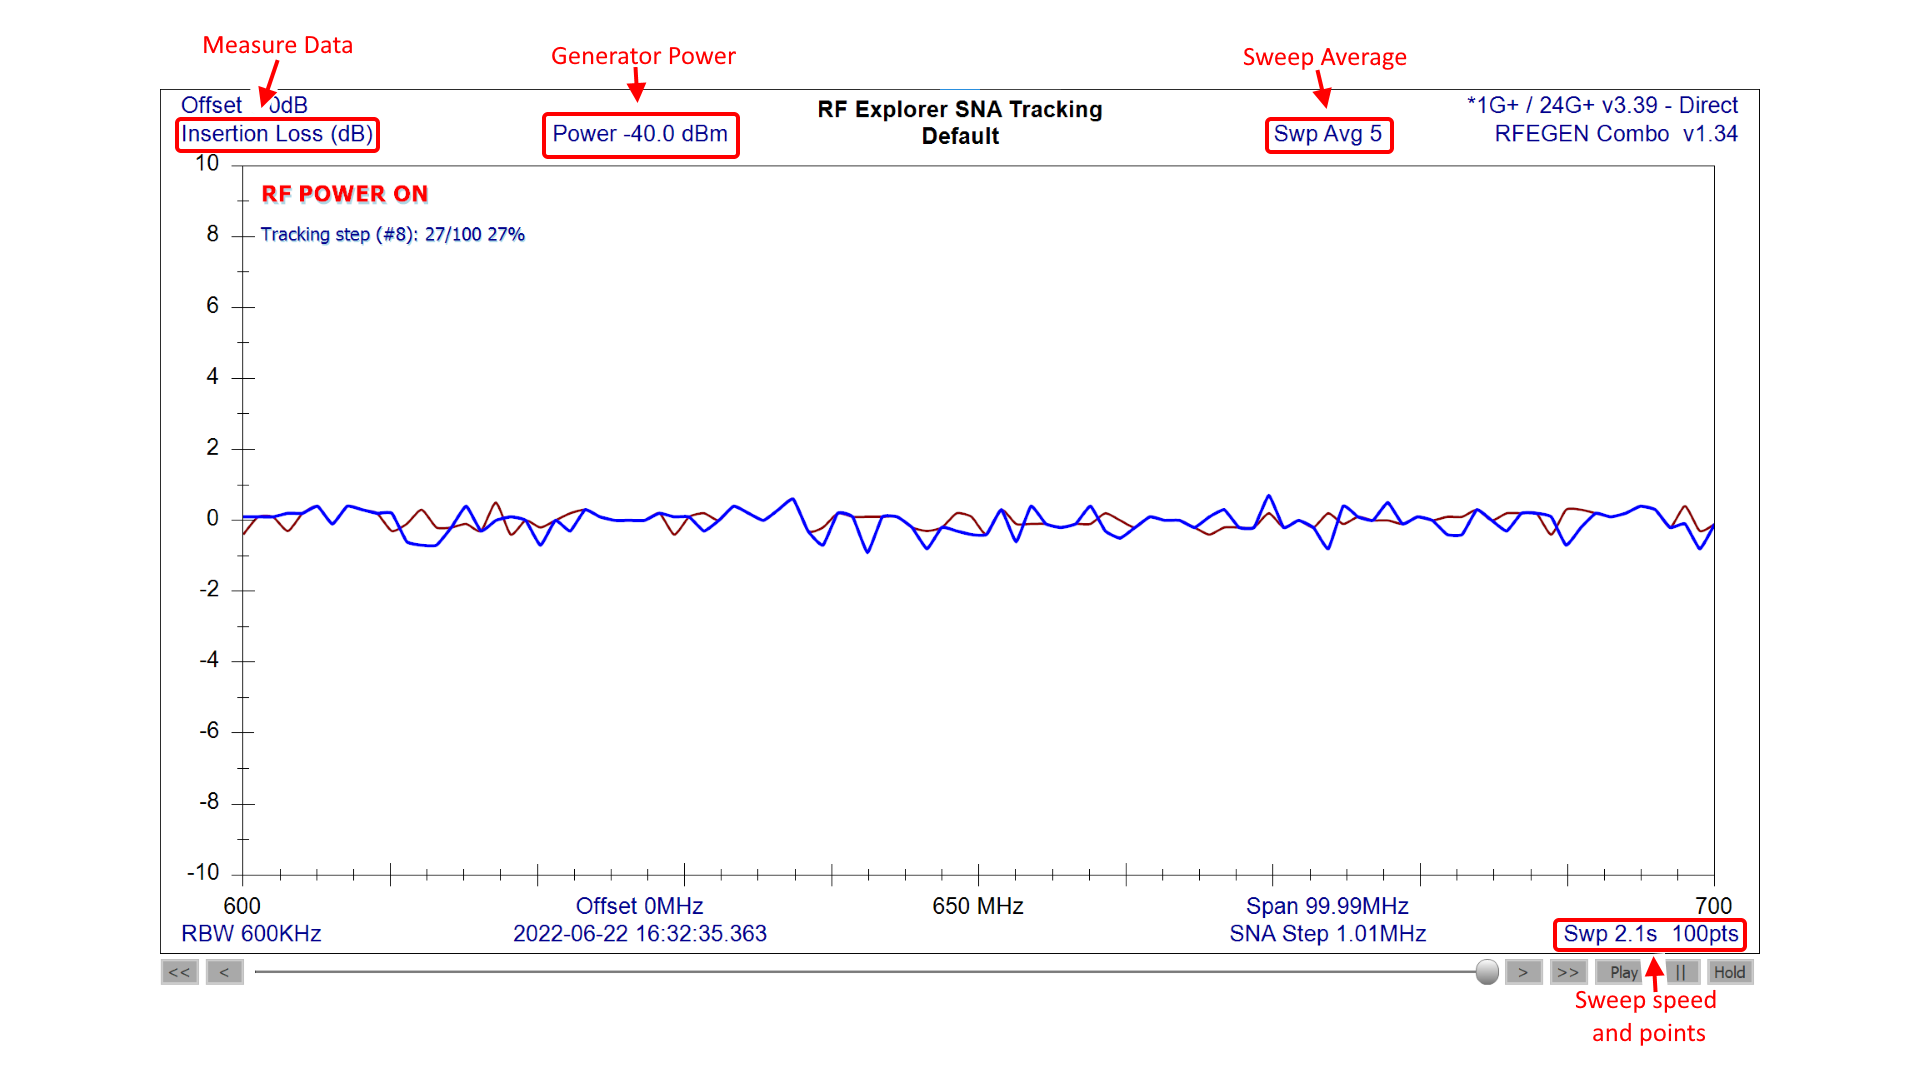
RF Explorer Signal Generator connected
Touch Labels
Some parameters can be easily configured by screen touch or click marked with red areas in picture above.
Press each of these regions to change:
- Measure Data - Change with selection dialog
- Generator Power - Change with dialog
- Sweep Average - Change with numeric dialog
- Sweep Speed and Points - Change tracking sweep steps with numeric dialog
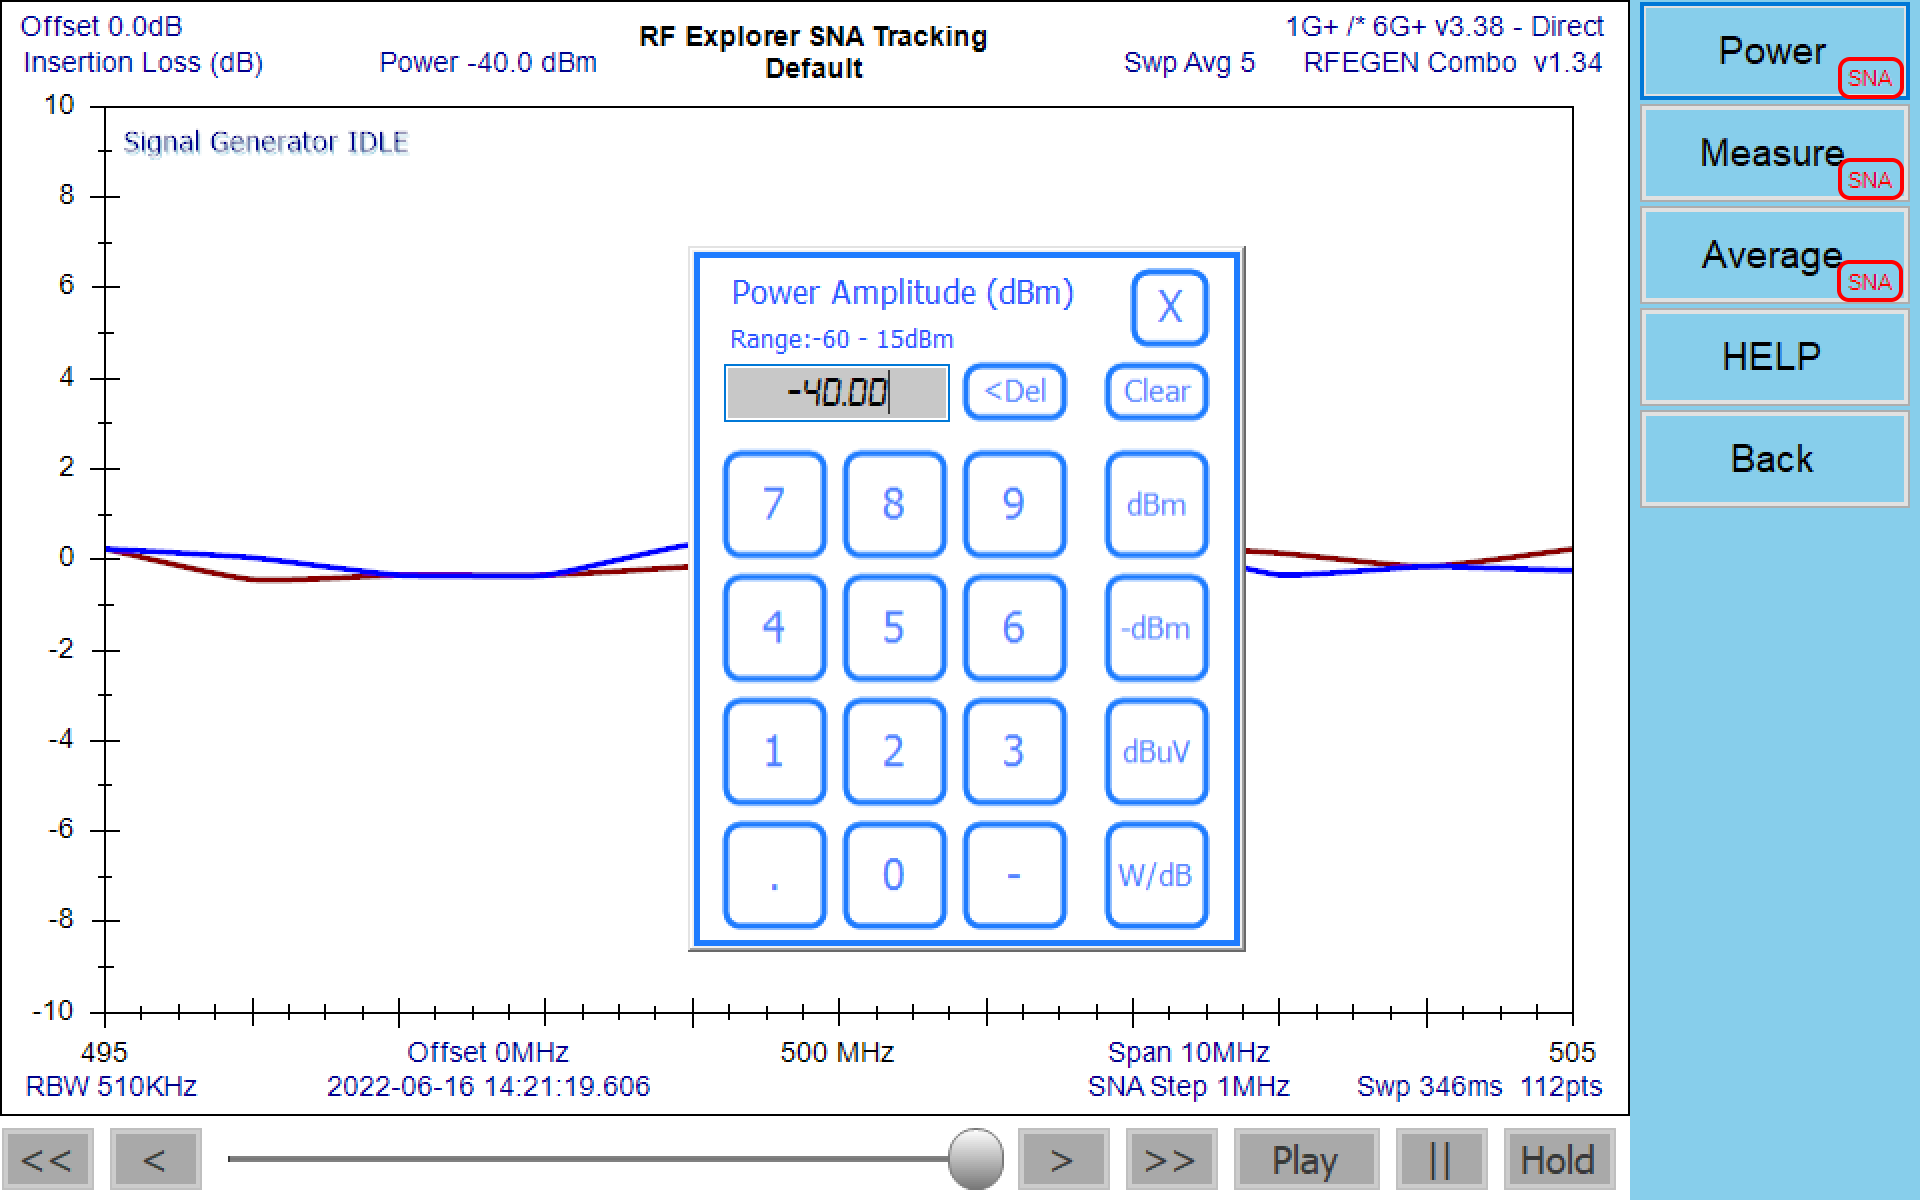
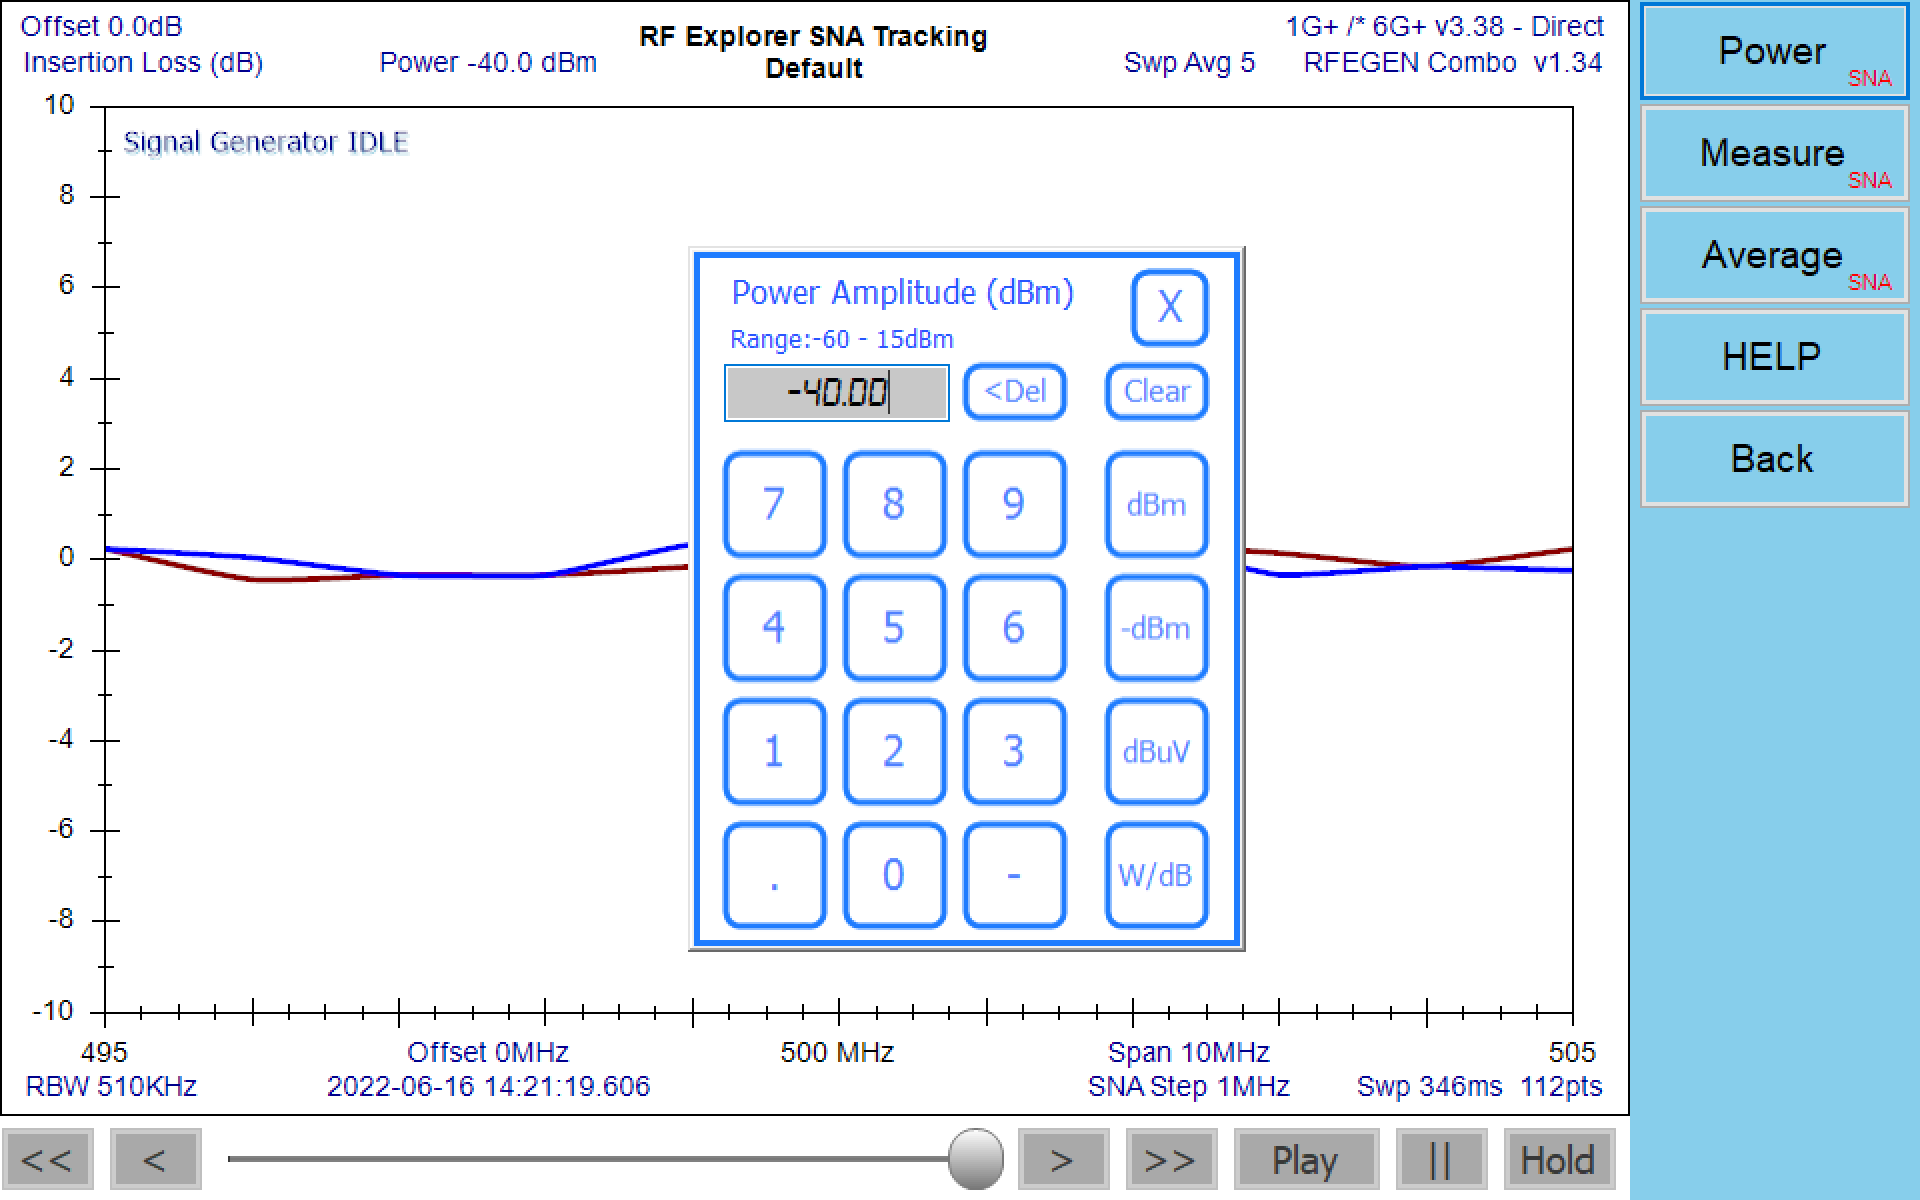
Amplitude Menu
Power
Select RF Explorer Signal Generator power for tracking SNA
Measure
Select display option to correctly interpret tracking sweep data
Average
Total number of sweeps to average samples, larger numbers improve noise rejection
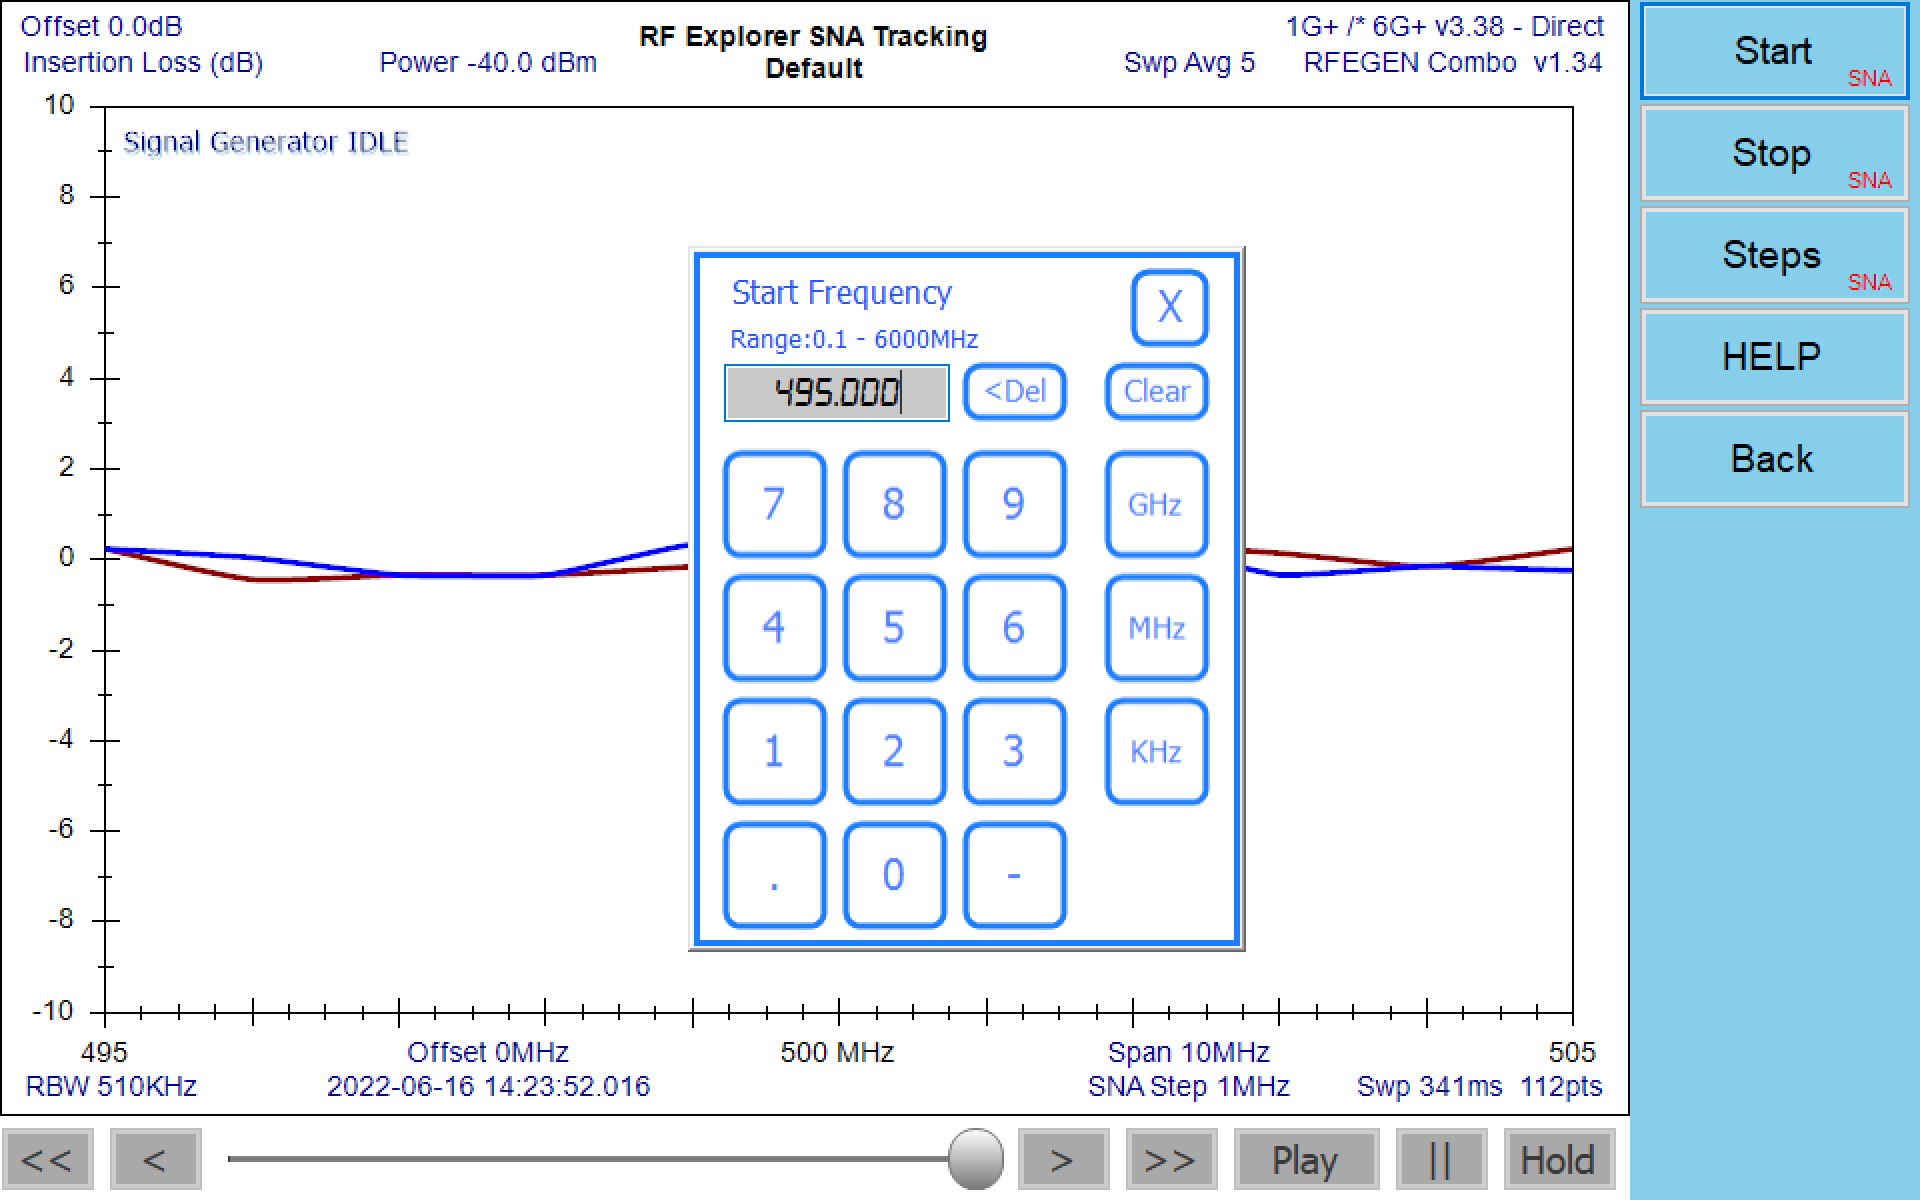
Frequency Menu
Start
Start frequency sweep
Stop
Stop frequency sweep
Steps
Tracking SNA steps. The more steps you use, the longer the sweep will take. Recommended values are from 50 to 200 steps for a good compromise of speed and resolution.
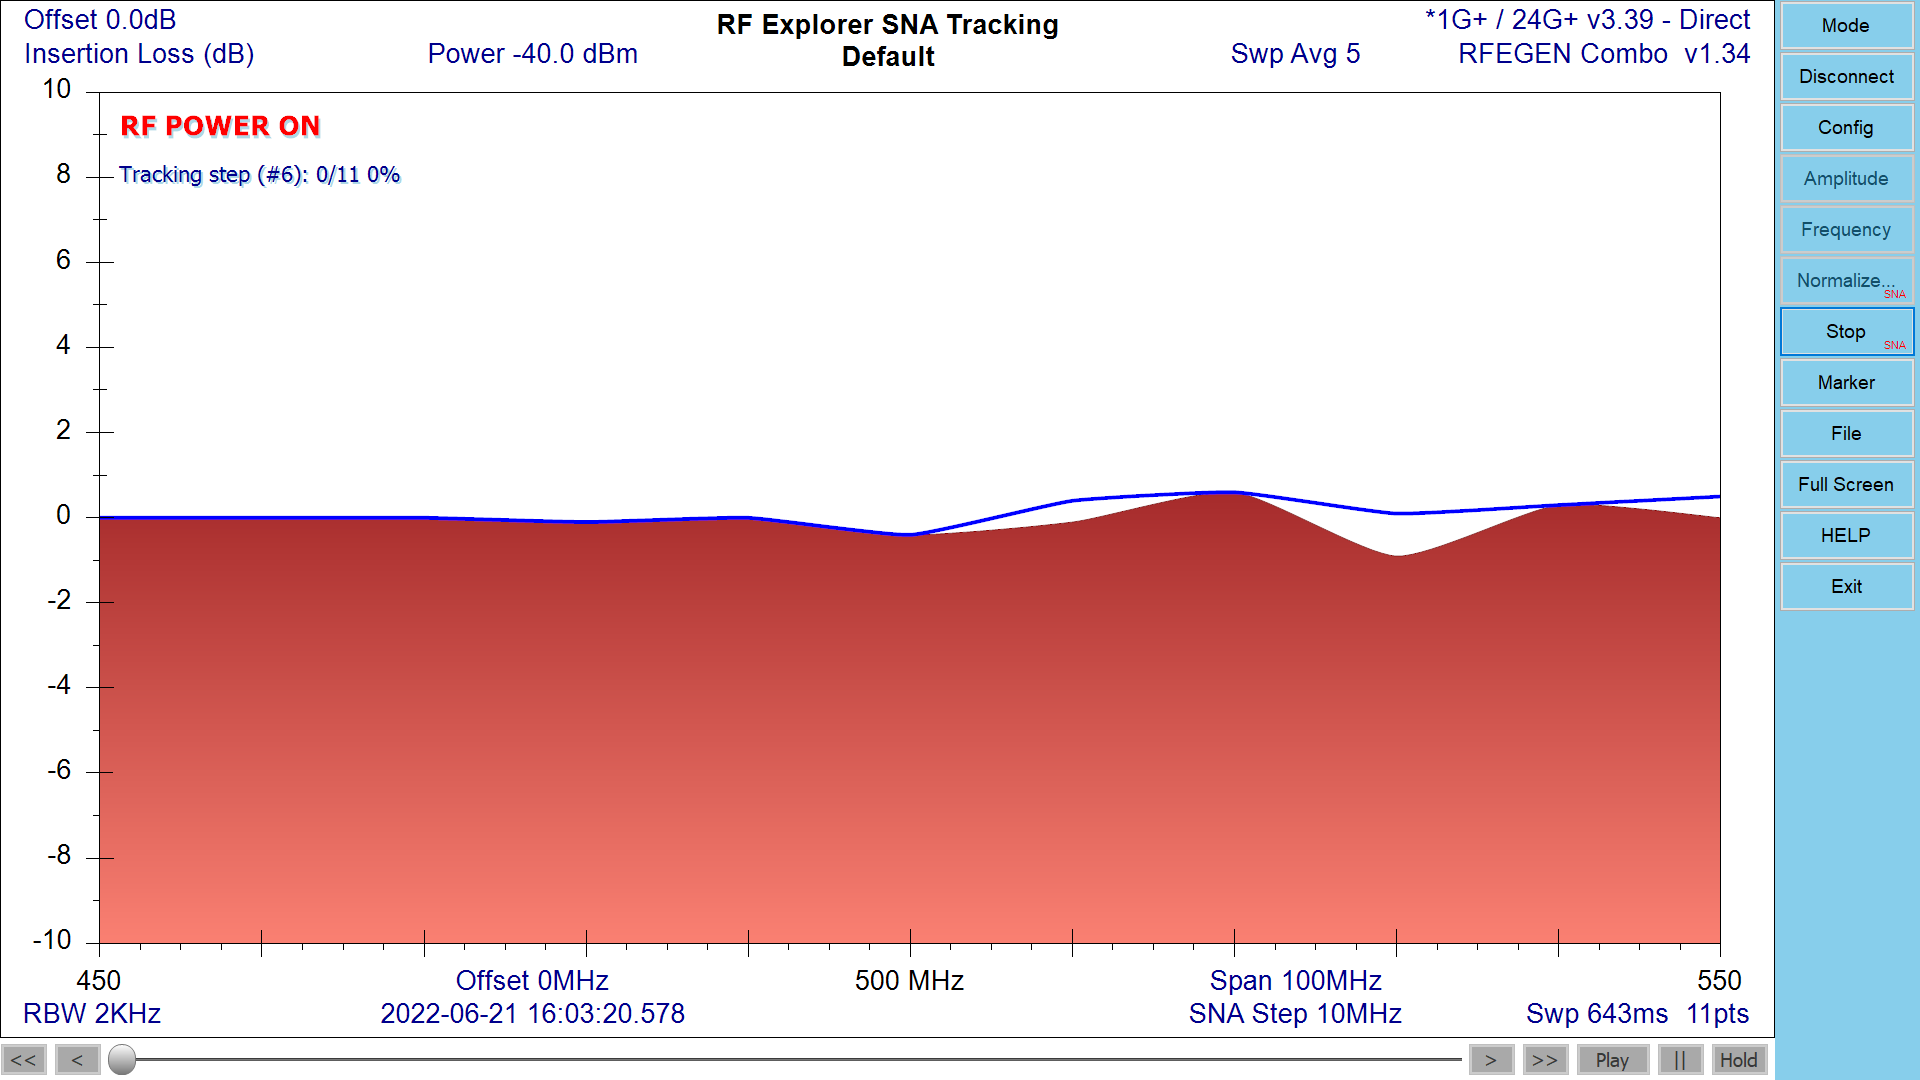
Normalize
Standard SNA requirement to rule out any cable, connector or environmental imperfection. The application will properly measure the response of your setup and will consider that 0dB response in order to refer any measurement to it.
Start/Stop
Perform/Finalize SNA for continuous tracking sweep. Screen will be updated with SNA results every few seconds.
The Start button is available when normalization process done successfully
The Stop button is available while performing tracking process
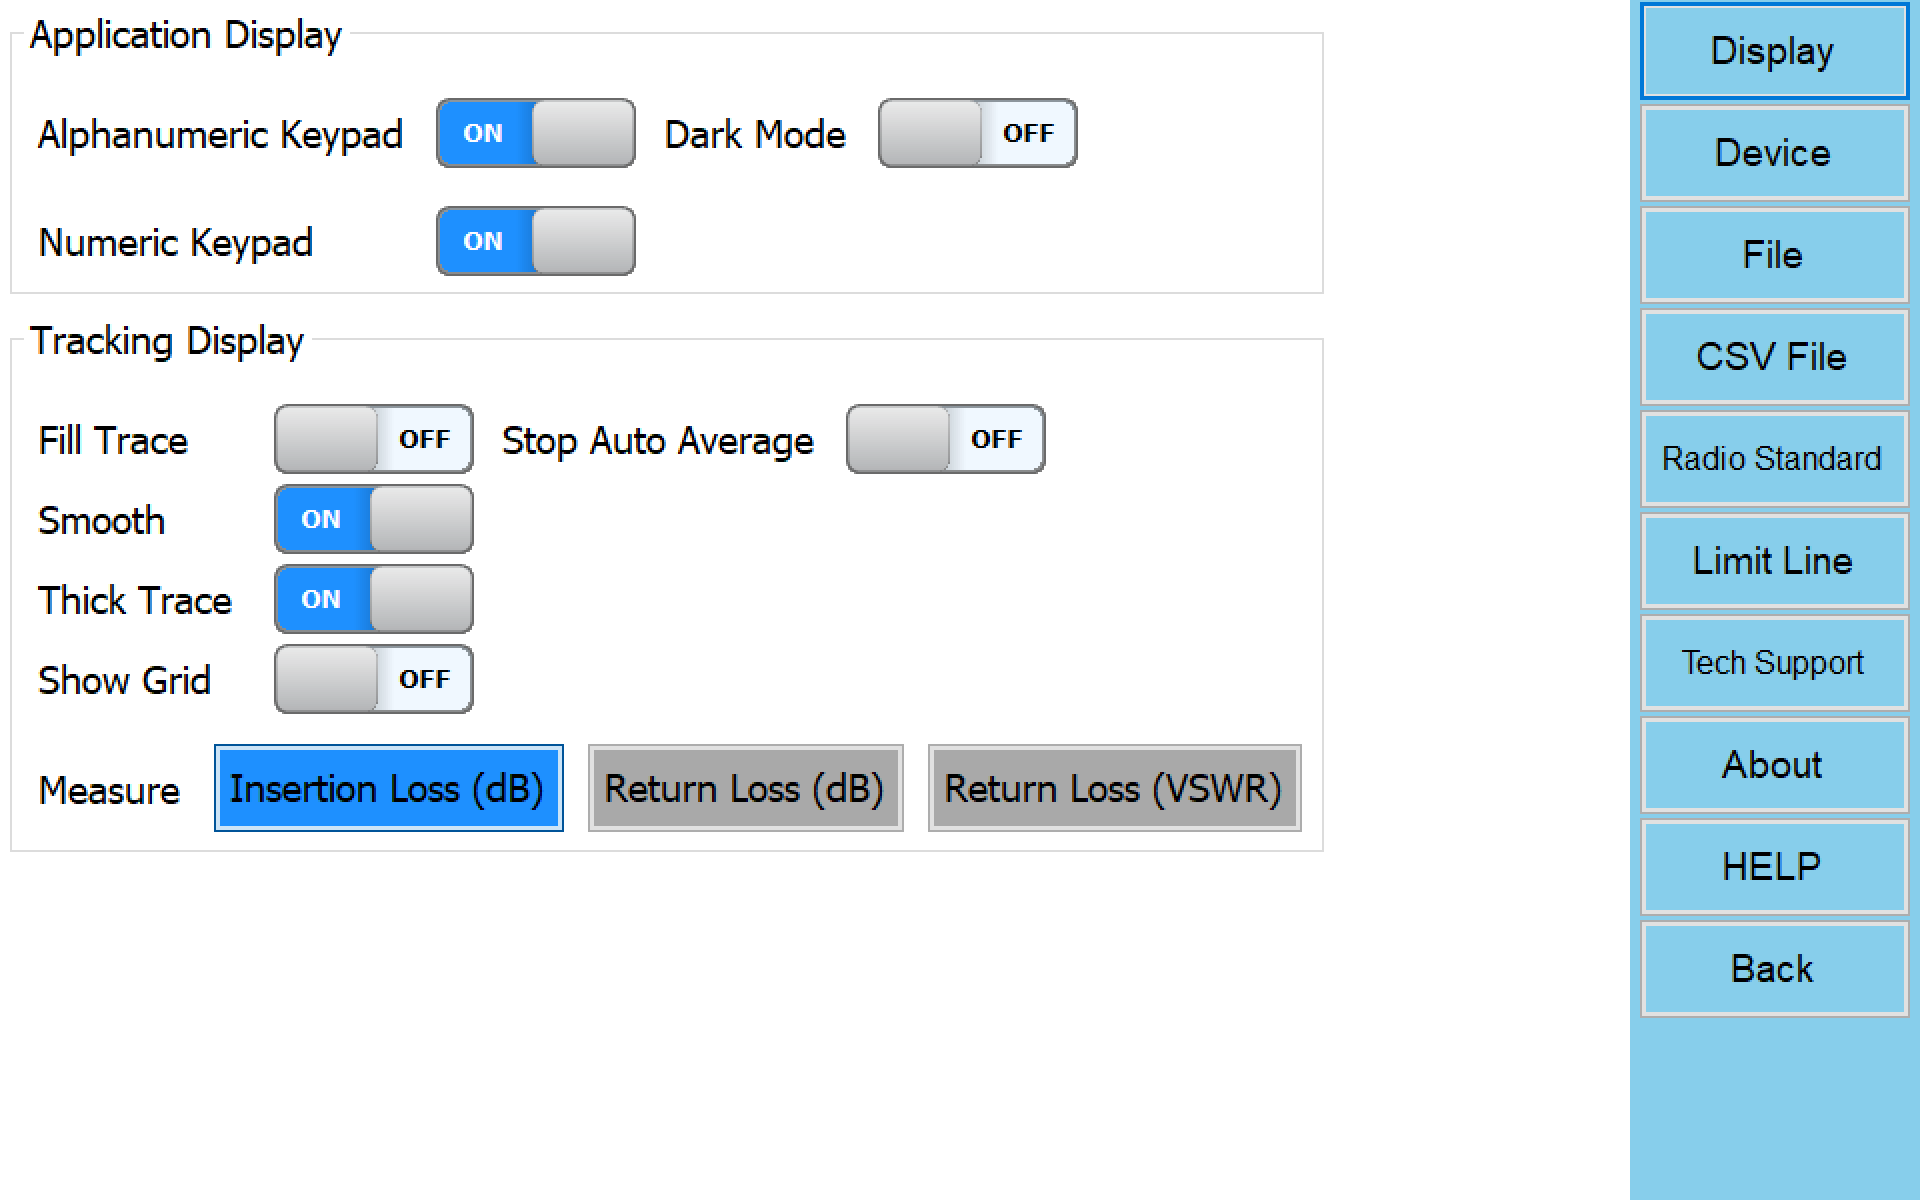
Configuration Options
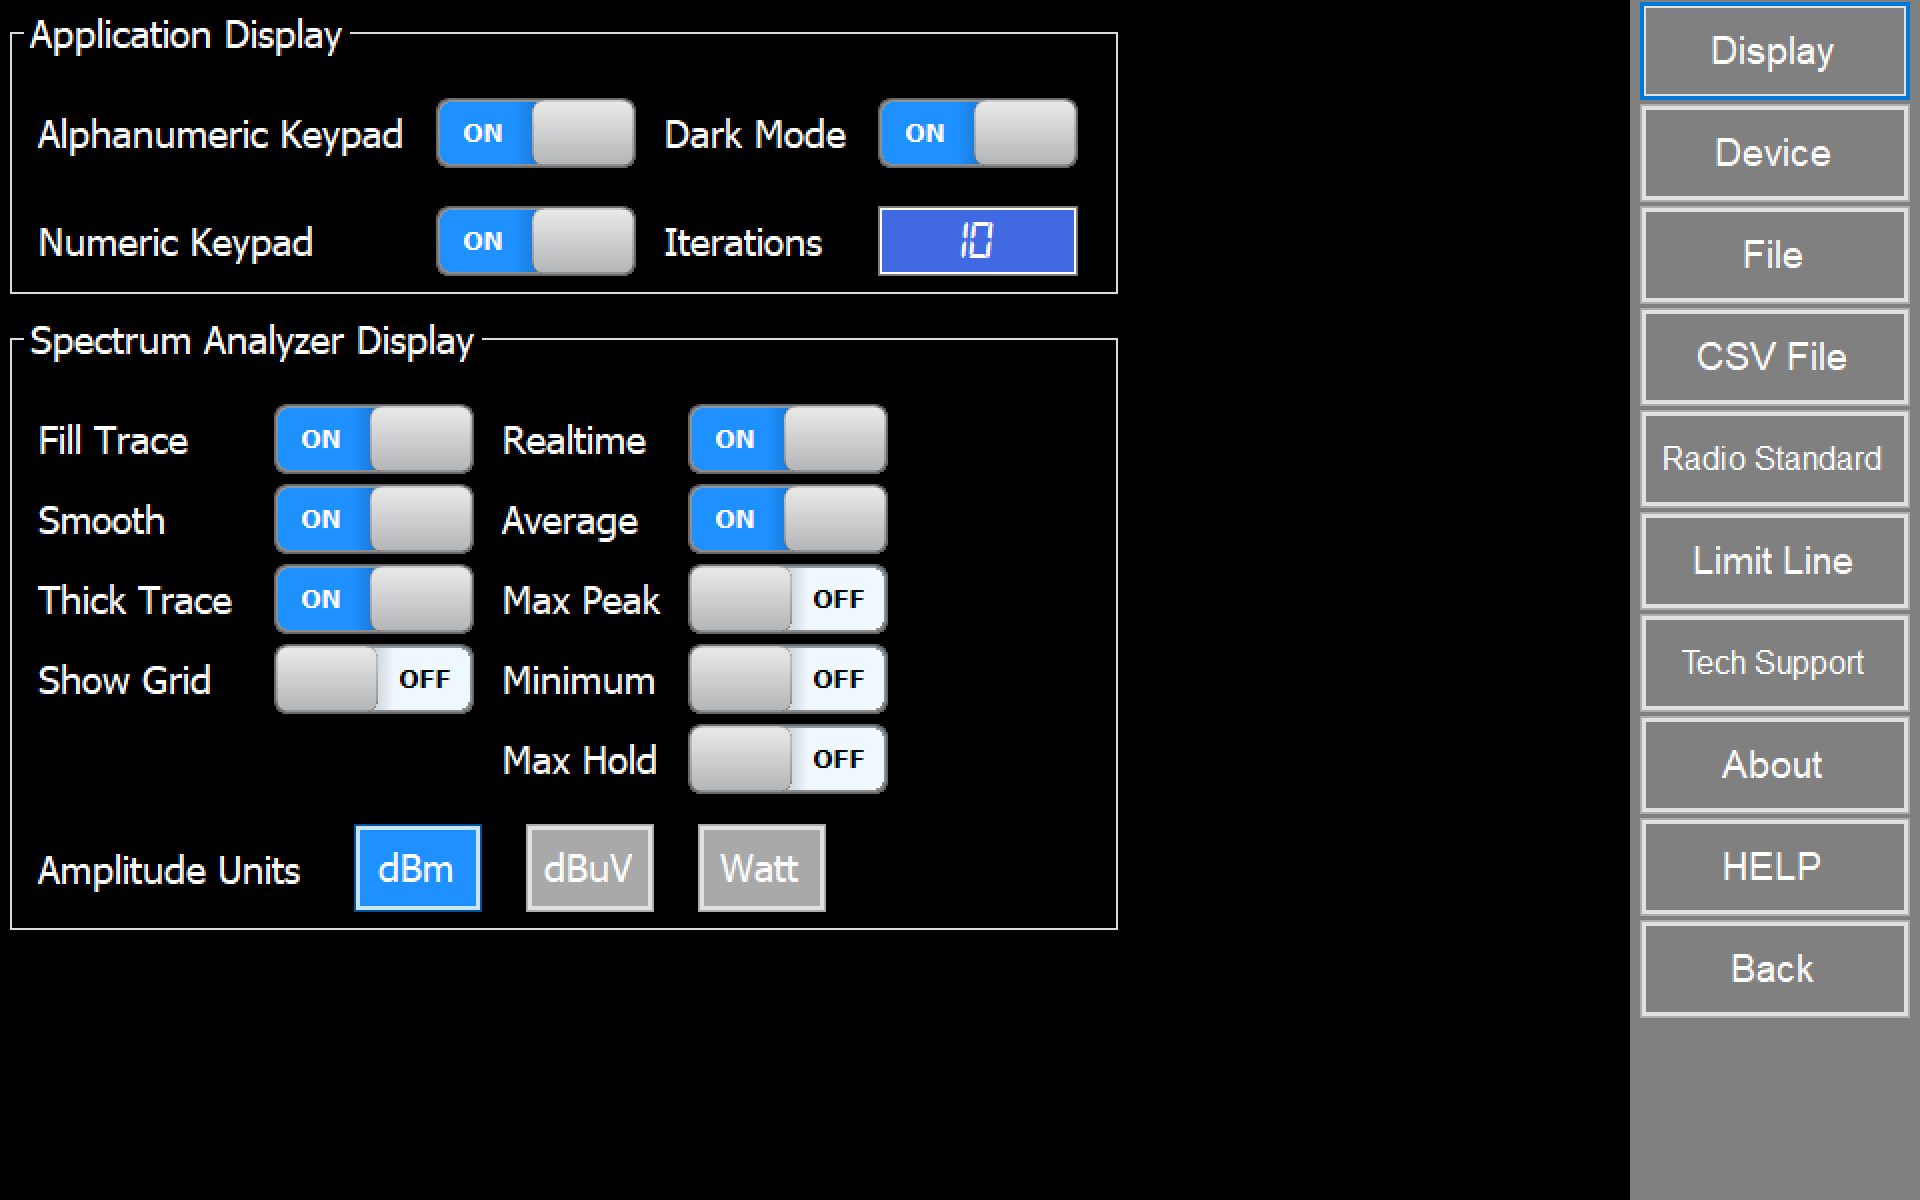
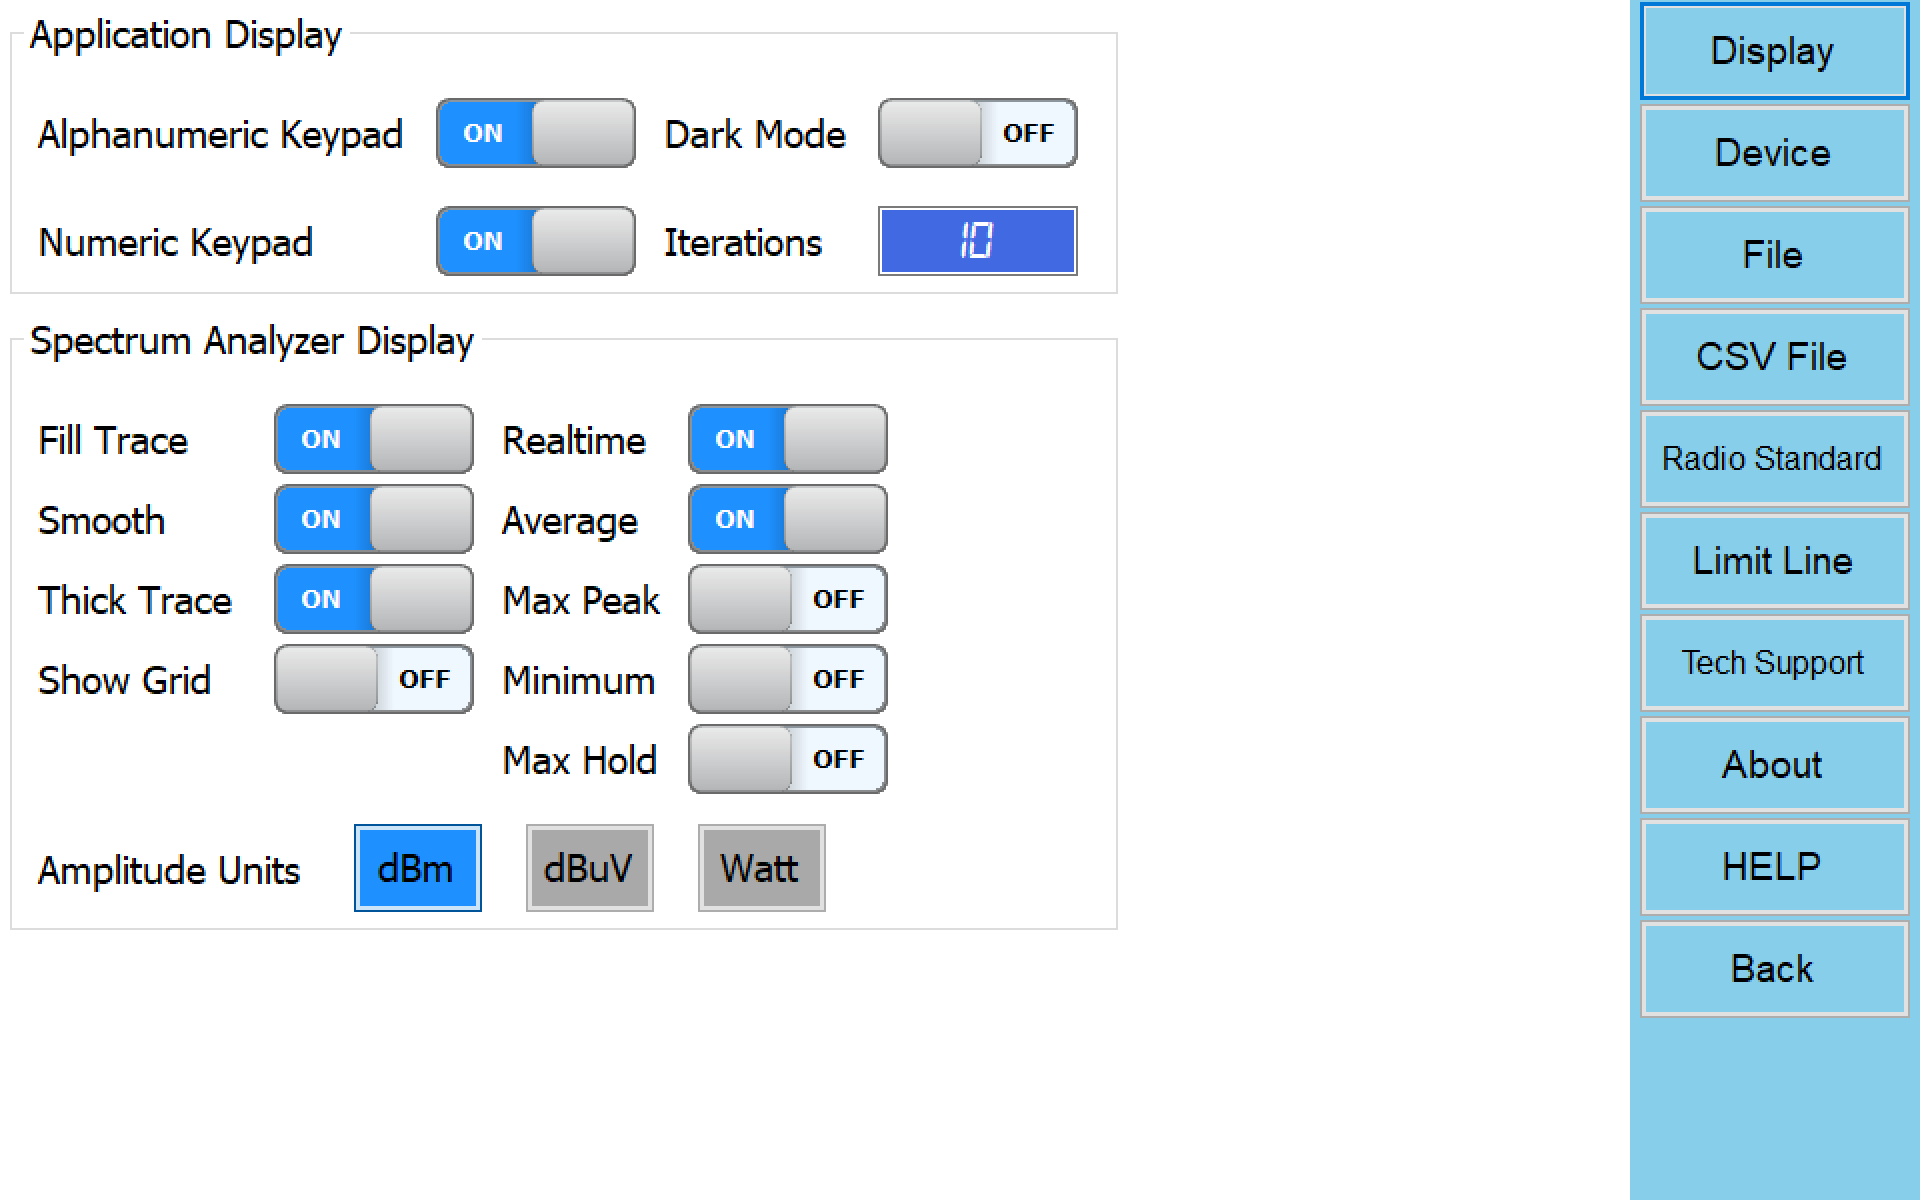
Application Display
Alphanumeric Keypad
Define preference to use a virtual alphanumeric keyboard, useful in touch capable tablets and laptops.
Numeric Keypad
Define preference to use a virtual numeric keyboard, useful in touch capable tablets and laptops. Note Frequency and Amplitude numeric dialogs are always active.
Dark Mode
Set a black background skin, closer to desktop instruments and easier to read in certain environments.
Iterations
The number of sweep data iterations to perform calculations on including Average and MaxPeak (not available for Tracking SNA mode).
Spectrum Analyzer Display
Fill Trace
Display a filled area in all signal shapes except Realtime signal.
Smooth
Use soft splines to join data sweep points in order to present a calculated soft curve
Thick Trace
Display trace with extra width
Show Grid
Show grid inside spectrum analyzer graph
Realtime
Raw data as captured with no post-processing.
Average
Arithmetic media of all the last iterations sampled.
Max Peak
Maximum value of all the last iterations sampled.
Max Hold
Maximum value of all captured samples regardless Iterations value.
Minimum
Minimum value of all the last iterations sampled.
Amplitude Units
Select amplitude units between dBm, dBµV or Watt to display data in analyzer graph.
Tracking Display
Stop Auto Average
Automatically stop SNA tracking after <Average> specified number of sweeps
Insertion Loss (dB)
Evaluate signal insertion loss in dB
Return Loss (dB)
Evaluate the ratio of the reflected power to the incident power in dB
Return loss (VSWR)
Evaluate the ratio of the maximum to minimum voltage on a loss-less transmission line
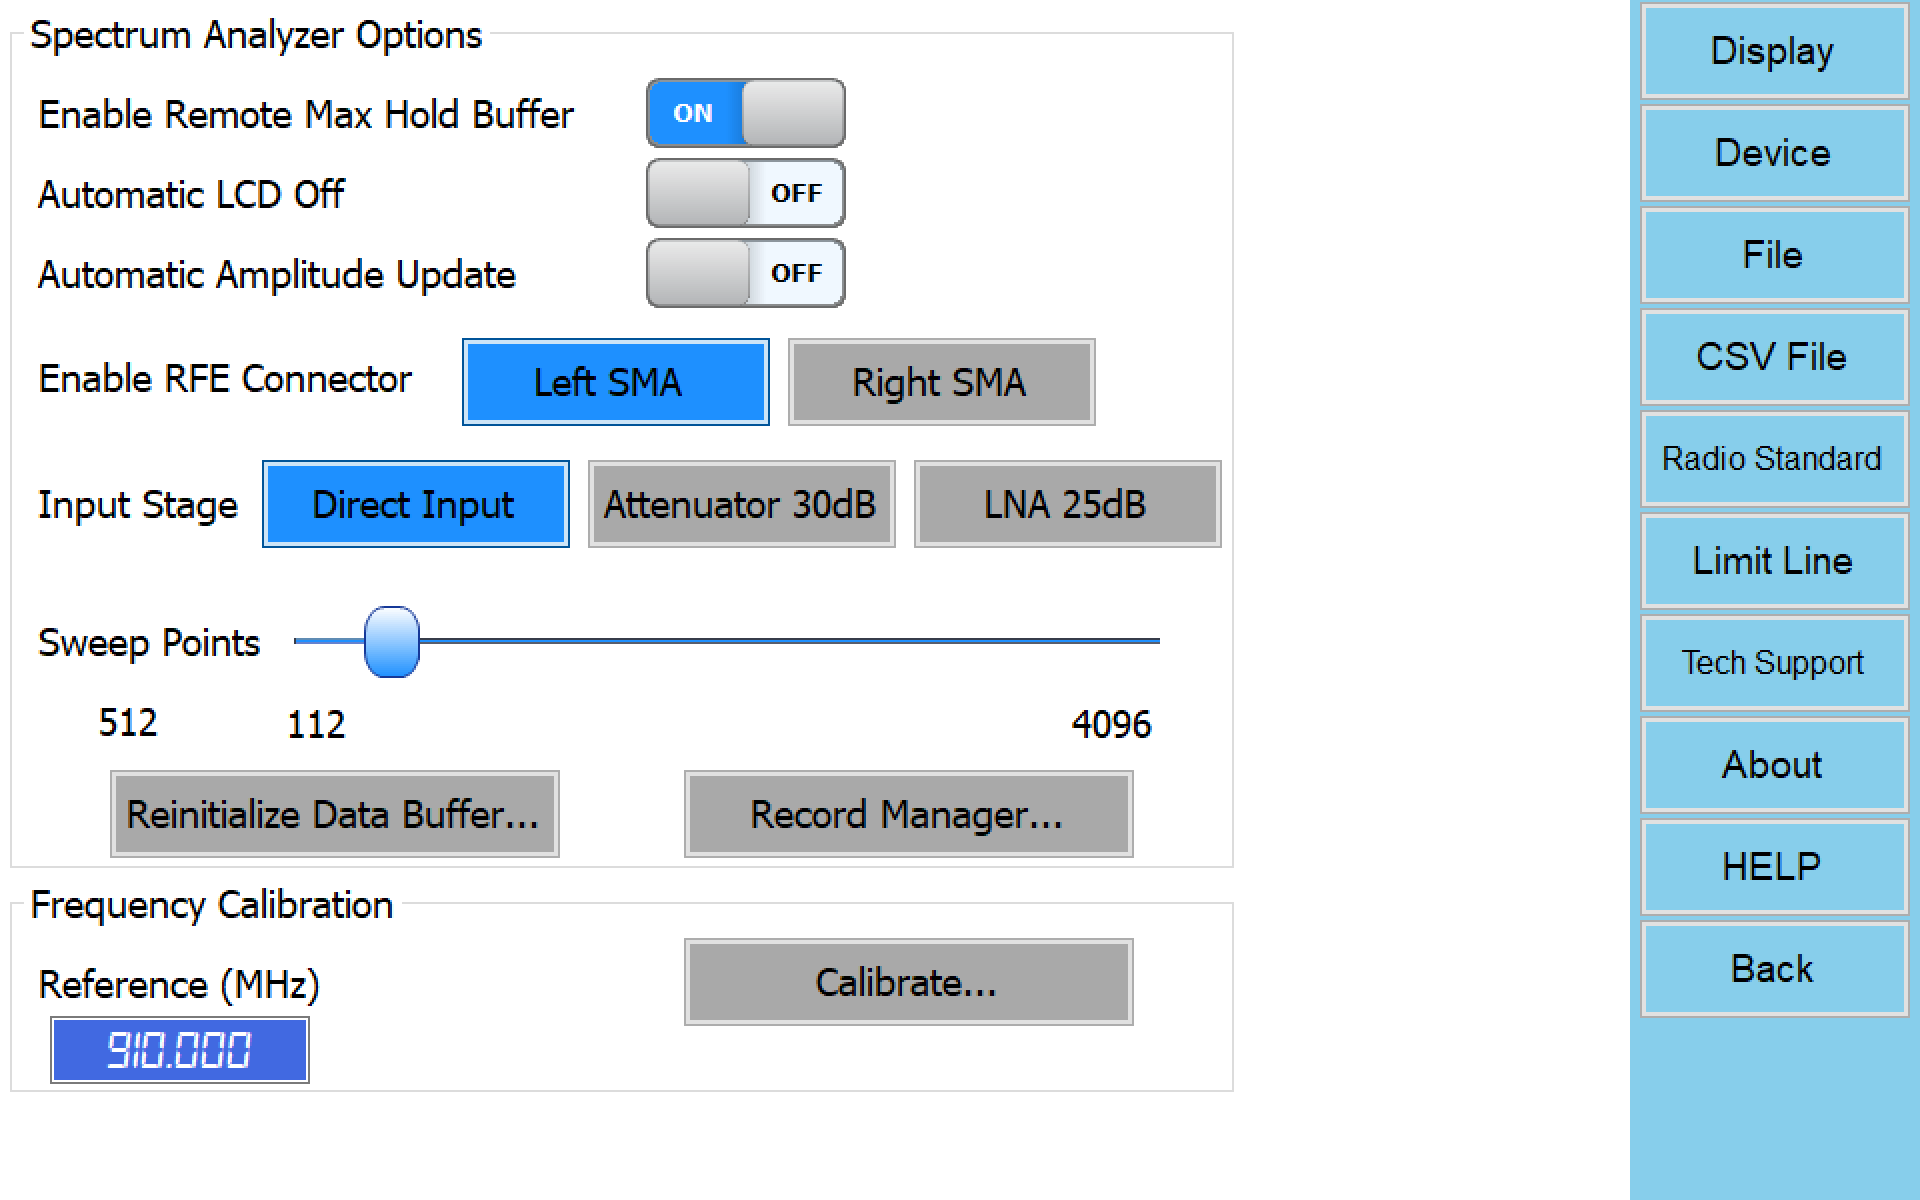
Device
Enable Remote Max Hold Buffer
Enable this to increase chances of fast changing signal capture, such as WiFi. Disable for extra accurate signal capture.
Automatic LCD Off
Automatically switch the LCD off for faster updates and help increase LCD lifetime. This option only will be enabled for RF Explorer devices with screen (Not supported for RF Explorer IoT).
Automatic Amplitude Update
Use this option to force the RF Explorer device to update amplitude visual range, or disable for fast local updates with no need to remote updates. This option is only available for RF Explorer devices with embedded screen (Not supported for RF Explorer IoT).
Enable RF Connector
- Left SMA: Use this option to enable remote device port on the left RF connector (Main board).
- Right SMA: Use this option to enable remote device port on the right RF connector (Expansion board). (Not supported for RF Explorer IoT).
Input Stage
Select input stage to enable Direct, Attenuator or LNA.
RF Explorer PLUS models and IoT
Low loss signal path to standard sensitivity, use for linear measurements up to -25dBm.
Note
The RF Explorer 6G COMBO PLUS model includes a 60dB additional attenuator. This is not currently supported by RF Explorer Touch but can be selected in the device menu.
Sweep Points
Resolution data points for each captured sweep in spectrum analyzer device. This feature is currently supported in PLUS, ProAudio and IoT models only.
Supported values:
- Windows, Linux and MacOS: 112, 240, 512, 1024, 2048, 3072 and 4096 points
- Raspberry Pi: 112, 240, 432, 1024, 2048, 3072 and 4096 points
Reinitialize Data Buffer
Internally re-initialize the MaxHold buffers used for cache data inside the RF Explorer device.
Record Manager
Provides functions to store in computer sweeps stored in internal spectrum analyzer memory. For more details visit:
Frequency Calibration
Procedure to easily tune the RF Explorer Spectrum Analyzer with a reliable and accurate RF source to get the best possible frequency accuracy.
For more details visit:
Models WSUB3G, WSUB1G and 1G PLUS
Reference
Reference frequency point used to calibrate device. Recommended 910MHz (range available from 250 to 950MHz)
Calibrate...
Performs frequency calibration for supported models
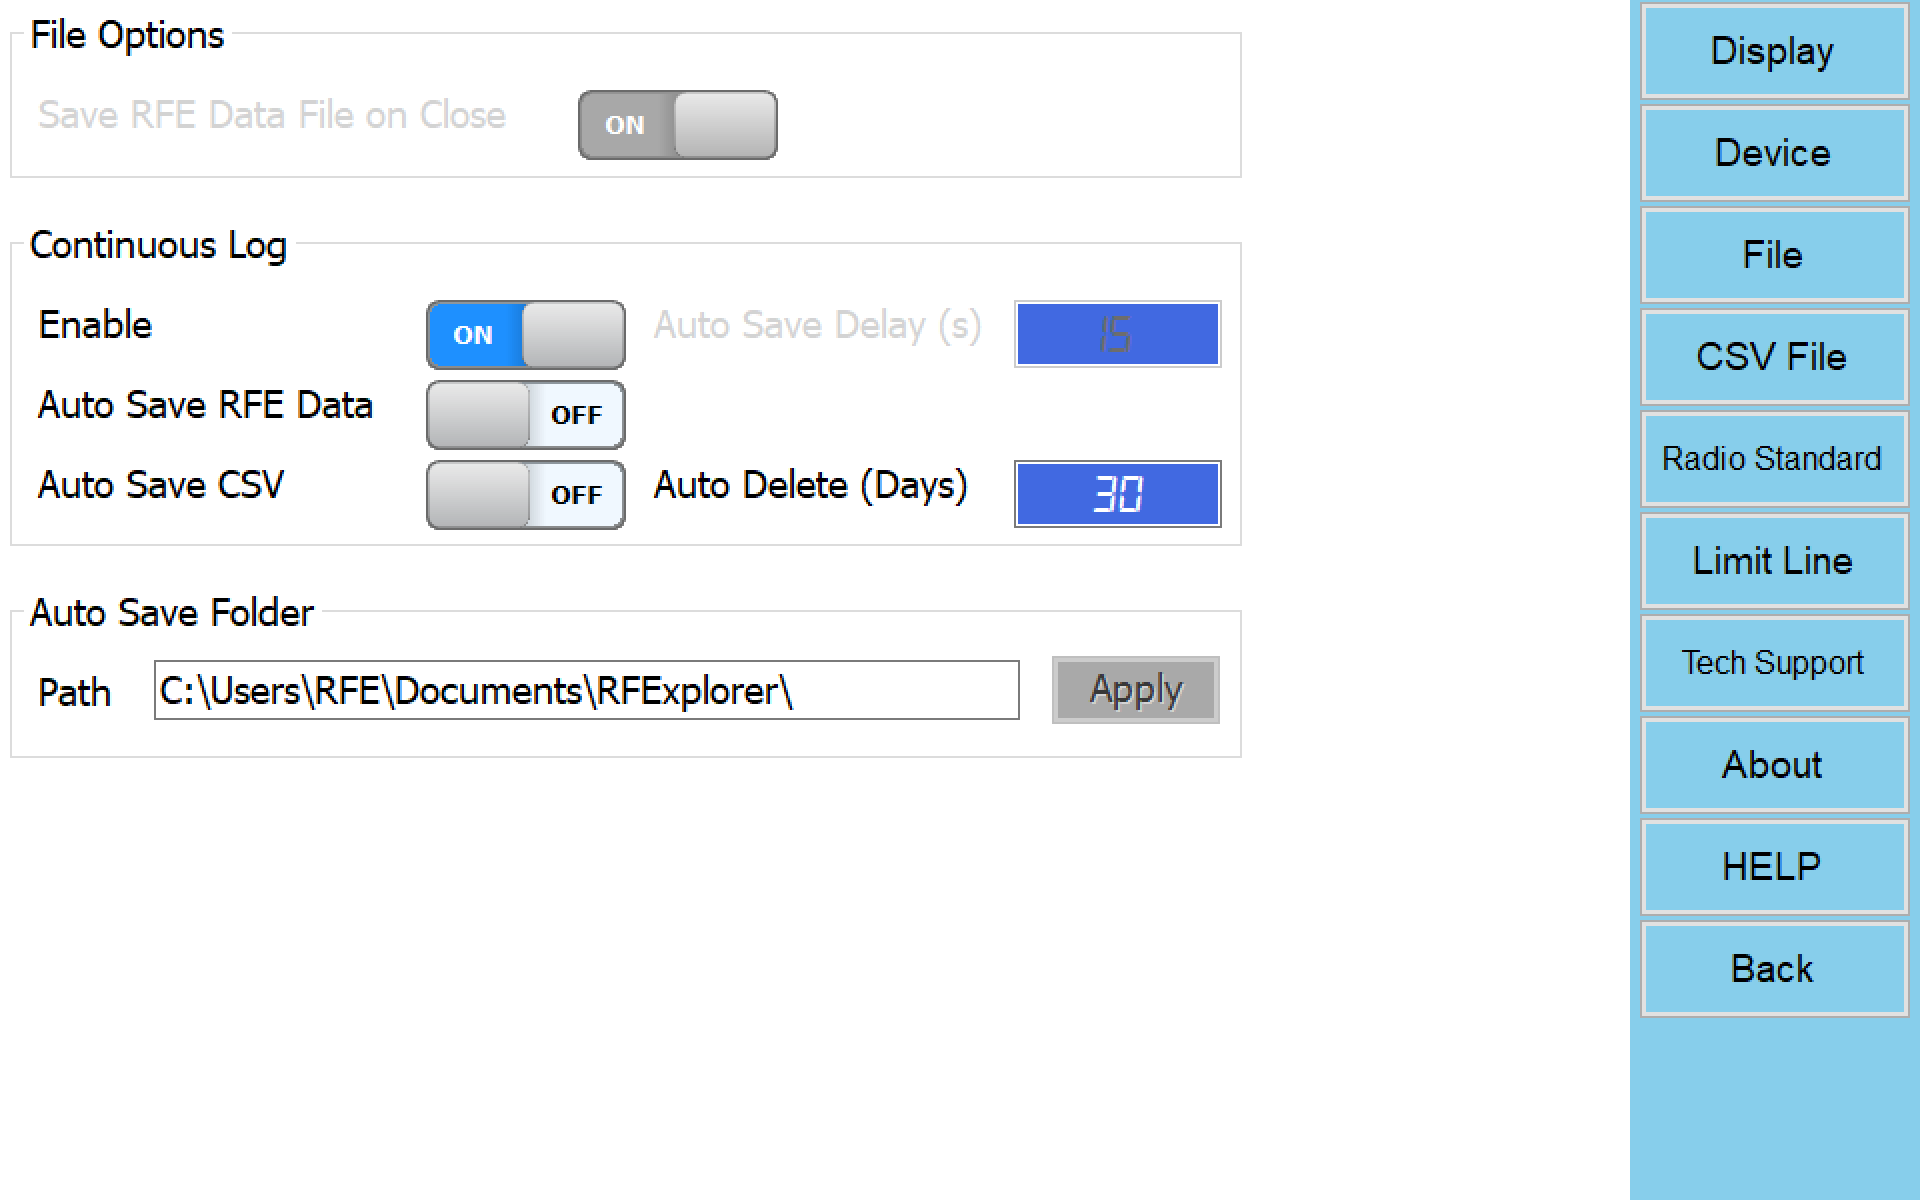
File
Save RFE Data File on Close
Save a RFE data file every time application is closed. If “Enable Continuous Log” option is enabled, this feature will be enabled automatically.
Enable
Enable continuous log to save RFE data or CSV files periodically in seconds as selected in “Auto Save Delay (s)” option. Also this option save a RFE data file in each configuration change in device and when application is closed.
Auto Save RFE Data
If “Enable” option checked, save a RFE data file every number of seconds selected in “Auto Save Delay (s)” option.
Auto Save CSV
If “Enable” option checked, save a CSV data file every number of seconds selected in “Auto Save Delay (s)” option.
Auto Save Delay (s)
Number of second for Auto-Save feature.
Auto Delete (Days)
Number of days for Auto-Delete old and unused files in user folder
Auto Save Folder Path
Directory where .RFE and CSV files will be stored if Auto Save feature is active
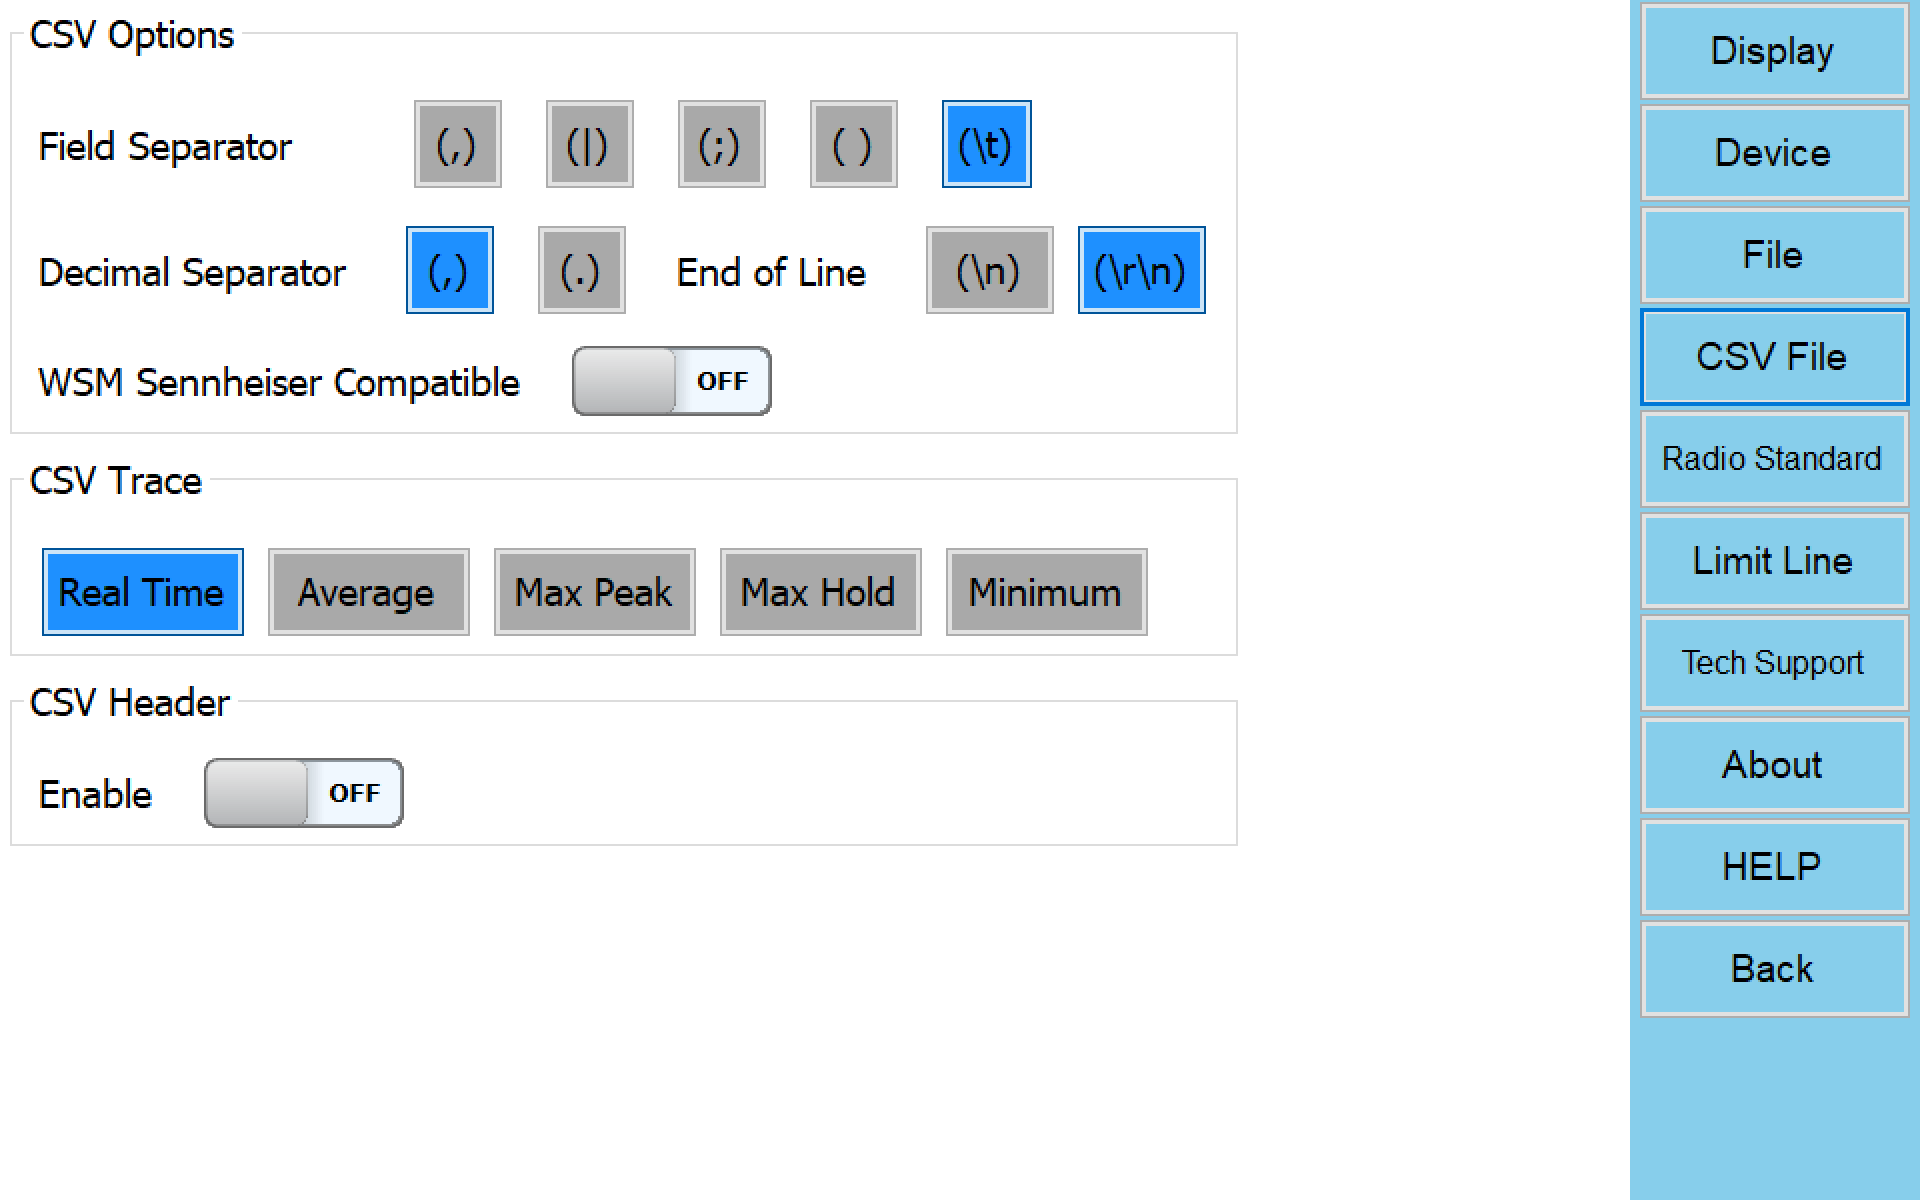
CSV File
Field Separator
Delimiter to use for CSV file generation.
Supported separators: Comma, Division, Semicolon, Space or Tabulator.
Decimal Separator
Delimiter to use as decimal separator.
Supported separators: Comma or Dot.
End of Line
End of line to use in for CSV file generation.
Supported end of lines: Line Feed (\n) or Carriage Return and Line Feed (\r\n).
WSM Sennheiser Compatible
When option is checked, CSV files generated can be imported directly in WSM Sennheiser software.
CSV Trace
Selected data trace used to generate the CSV file. There are multiple traces available (such as Real Time or Average) so it is important to select the right one for your needs.
CSV Header
Insert descriptive header inside generated CSV files.
Fields included are:
- Receiver
- Date/Time
- RFUnit
- Owner
- ScanCountry
- CRC
Important
The selected trace must be visible in the Spectrum Analyzer graph, if there are multiple visible the tool will select one by this priority order:
1. Average trace
2. Max Peak trace
3. Real Time trace
4. Max Hold trace
5. Minimum trace
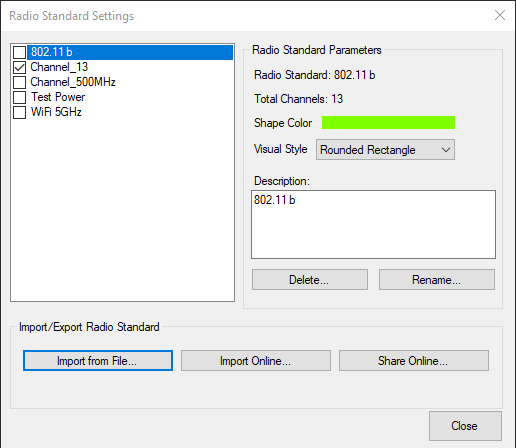
Radio Standards
Feature custom definition of Radio Standard channels.
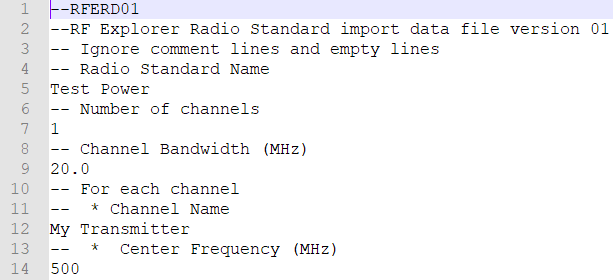
You can now import standards or define your own channels to be included in the Spectrum Analyzer graph of RF Explorer Touch.
Each channel in a Radio Standard will display:
Channel name
Visual shape of the actual bandwidth and channel position
Computed individual power channel
All parameters of a Radio Standard can be configured in the menu option Config -> Radio Standards -> [Configure...]
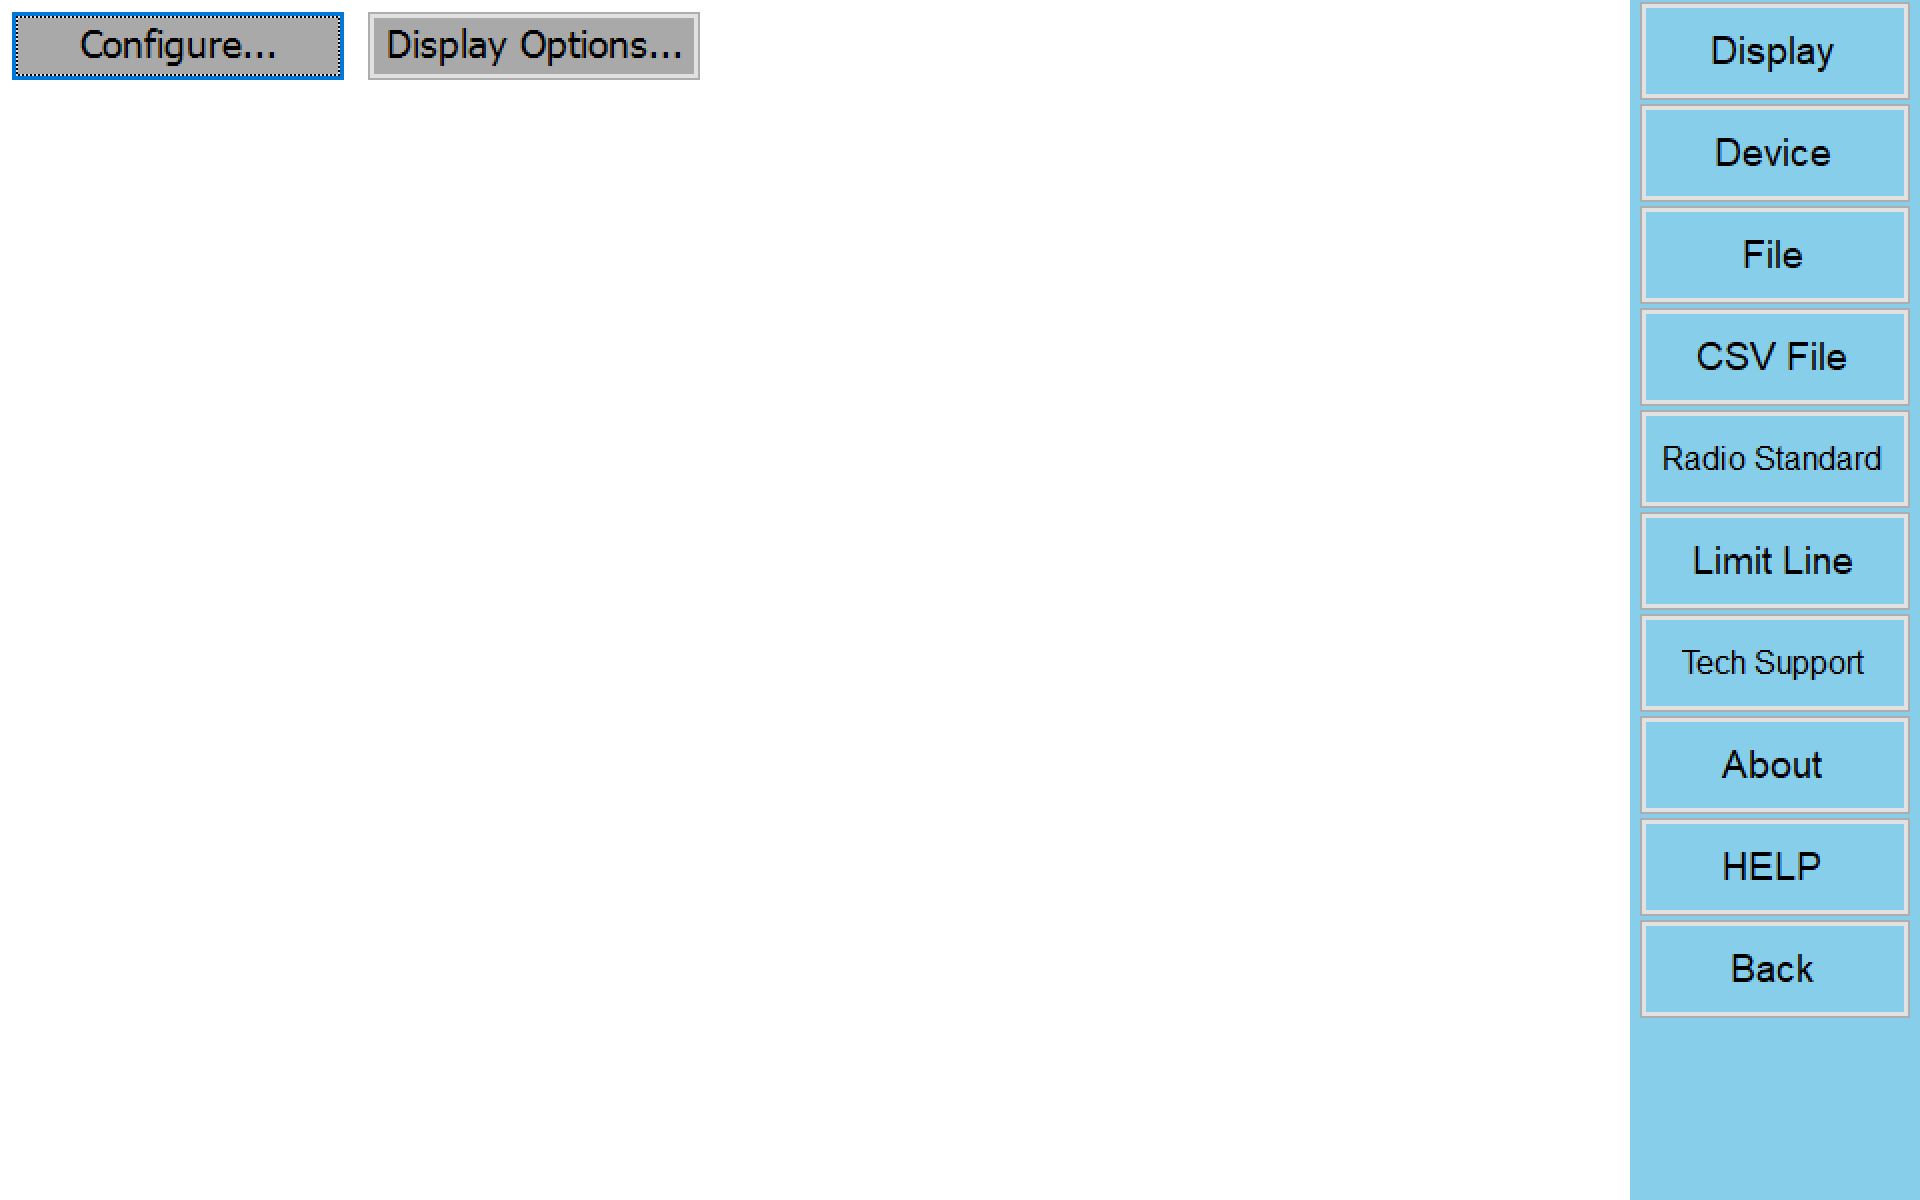
This will open a configuration dialog to setup parameters, select which Radio Standards are visible (up to 10 at any given time), import new Radio Standard definitions, etc.
- Go to “Config” menu.
- Select “Radio Standard” option.
- Click on [Configure…] button.
- Check intended Radio Standard on the list.
- You can include a suitable description, change color and channel shape, rename it, etc.
Note
A maximum of 10 Radio Standards can be selected as visible at any given time.
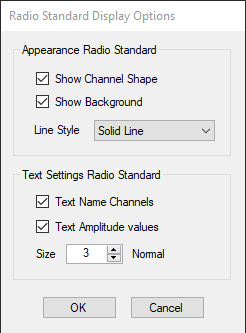
Display Options
To configure Radio Standard display options go to Config -> Radio Standard and click on [Display Options…] button.
Appearance
“Show Channel Shape” option: Enable/Disable Radio Standard channel shape display.
“Show Background” option: Enable/Disable shadow among channel bandwidth display.
“Line Style” option: Define how channels will be drawn. Values:
- Solid Line
- Dashes Line
- Dotted Line
- Dash and Dot line
Text Settings
“Text Name Channels” option: Enable/Disable channel name display.
“Text Amplitude Values” option: Enable/Disable channel power values display.
“Size” option: Select channel text font size
Limit Lines
An advanced and powerful tool in the spectrum analyzer mode is the ability to work with Minimum and Maximum Limit Lines.
These are fully configurable, visual and optionally audible alarm feature with multi-data point lines to determine power limits.
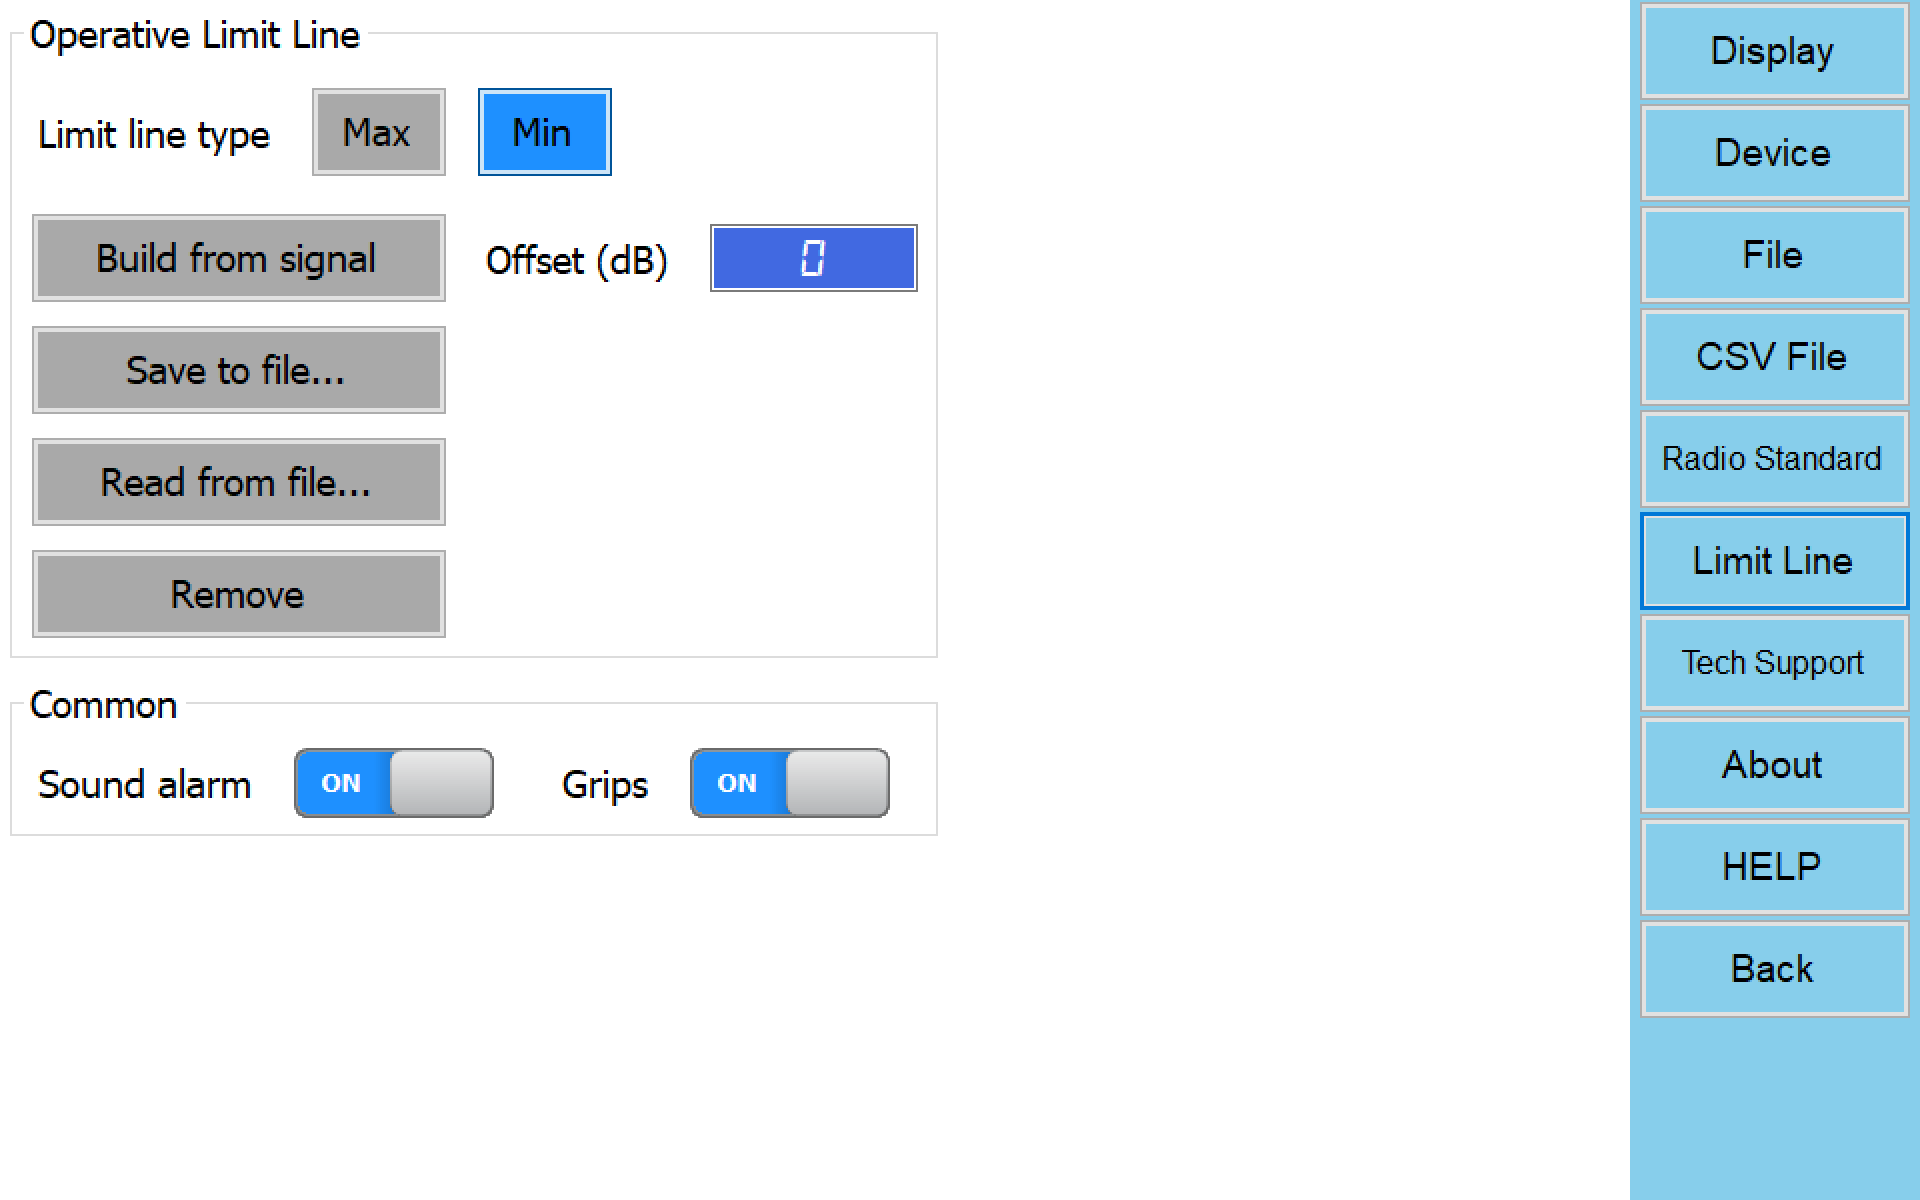
Operative Limit Line
Limit Lines are fixed thresholds, and only one pair of Max / Min limit lines can be specified at any given time.
These settings apply to one limit line type at a time: maximum or minimum. Use to define or change parameters of each limit line as required.
Different limit lines can be loaded from file or generated from a signal trace anytime.
Limit line type
- Max: select to apply changes to maximum limit line.
- Min: select to apply changes to minimum limit line.
Build from signal
Generate maximum or minimum limit line from a currently selected signal trace specifying a positive offset in dB. This offset will be added or subtracted depending on limit line type selected
Save to file
Save maximum or minimum limit line to a limit line file (.rfl).
Read from file
Load maximum or minimum limit line from a limit line file (.rfl).
Remove
Remove maximum or minimum limit line from spectrum analyzer screen.
Common
These settings apply in common to both maximum and minimum limit line
Sound alarm
To enable or disable an audio alarm for as long as the condition is not met
Note
The alarm sound type is preconfigured, but can be easily customized by replacing the file notify.wav from the RF Explorer application data folder (%appdata%\roaming\rfexplorer).
The file can be any valid .wav file. The minimum duration of the audio alarm is the duration of the .wav sound file.
Grips
To enable or disable circle gripped in limit line traces. For high resolution mode, circles might make it hard to see how close limit line trace from signal trace is.
Technical Support
Create a compressed ZIP file with activity logs, configuration files and report files in order to diagnose application issues. Only required if requested by RF Explorer Tech Support.
About
Show application, Operating System and, if connected, device details
How to change application appearance
Note
In macOS, appearance will change after [Back] button is clicked and returned to main screen.
Frequency and Amplitude configuration
Set frequency and amplitude values for device.
This can be modified if RF Explorer device is connected only.
Spectrum Analyzer
Change Frequency
Click on [Frequency] and click on desired parameter to set in device.
For more details see:
Change Amplitude
Click on [Amplitude] and click on desired parameter to set in device.
For more details see:
Tracking SNA
Change Frequency
Click on [Frequency] and click on desired parameter to set in device.
For more details see:
Change Amplitude
Click on [Amplitude] and click on desired parameter to set in device.
For more details see:
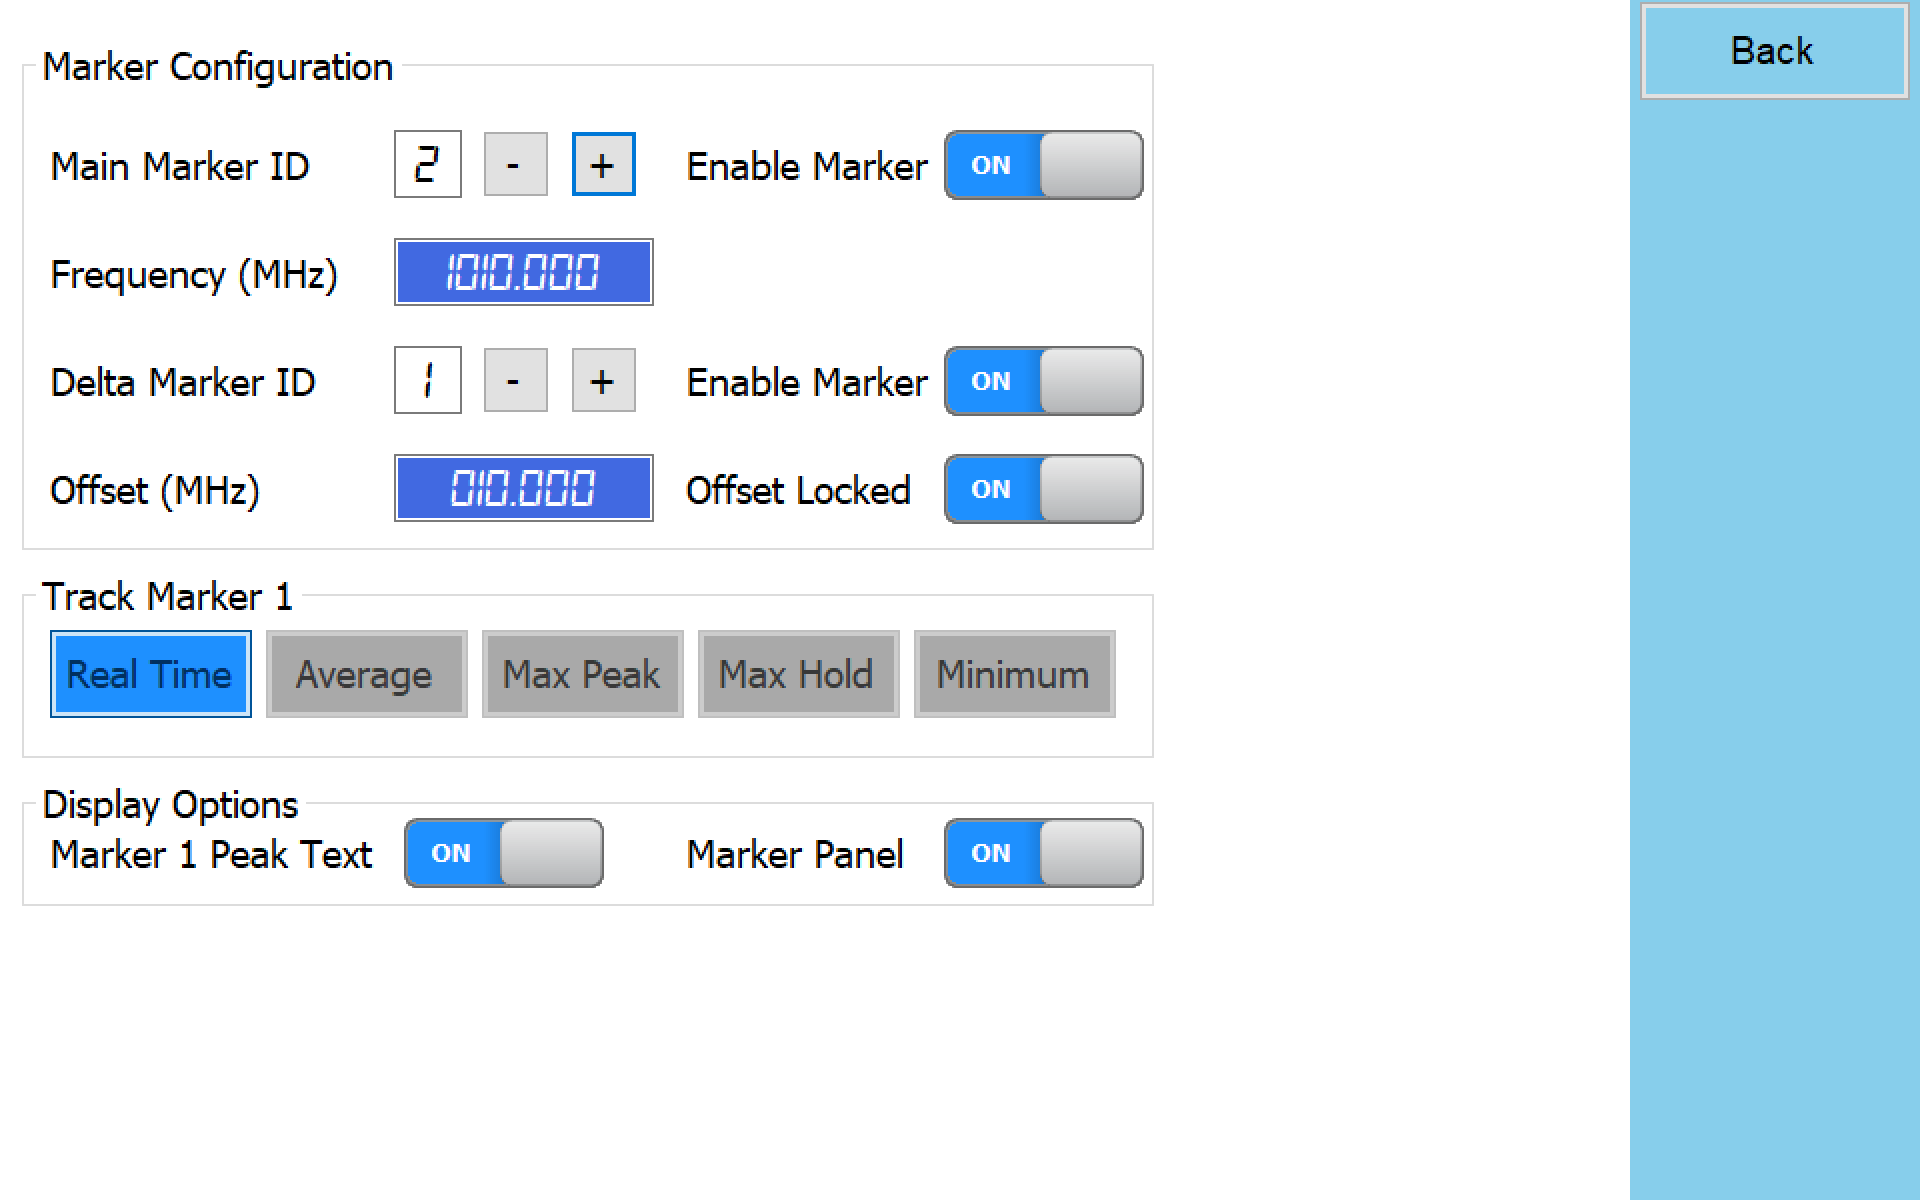
Markers
Configuration parameters to display markers in Spectrum Analyzer mode or Tracking SNA graphs and markers panel.
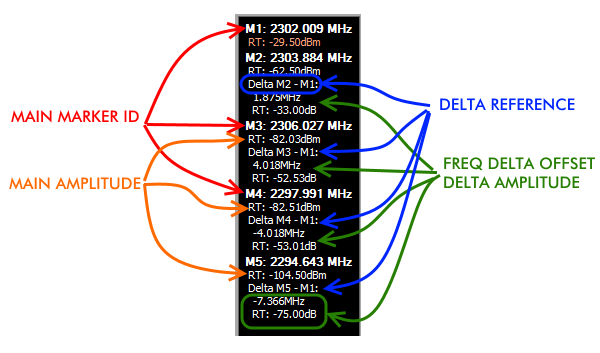
Main Marker ID
Marker Identification number. Check “Enable Marker” option to set a marker.
Frequency (MHz)
Marker frequency (Only allowed for markers 2 to 10).
Delta Marker ID
Delta Marker Identification number. Check “Enable Marker” option to set a delta marker.
Offset (MHz)
Frequency difference in MHz between delta marker and its reference marker.
Offset Locked
Enable a dynamic follow-up of the Delta ID to the Marker ID selected. It will follow the reference Marker if it changes position.
Track Marker 1
Define trace that marker 1 follow in visual representation
Marker 1 Peak Text
Show peak frequency and amplitude values for marker 1
Marker Panel
Show or hide markers panel to display visible markers table.
Overwiew
- Marker 1: It is special marker. It will search for peak trace point on screen and will track automatically. Therefore, frequency point for Marker 1 cannot be defined, will be dynamically updated by the application every sweep.
- Markers 2 to 10: These markers are defined for a specific frequency point, and will show amplitude values for all enabled traces on that frequency.
- Delta markers: This markers will be a reference of other marker, that is, it will be linked with a particular marker.
How to set up a peak marker
How to set up a manual marker
How to set up a Delta marker
Notes
- Special Marker 1 can be Delta Marker of any other, but it cannot have associated any Delta Marker by Offset. The reason for this is Marker 1 works as auto-peak therefore cannot be defined as reference of any other.
- Markers defined by Offset use the value at the time of Marker definition, but does not update or keep that offset fixed if the Delta Marker changes frequency. For instance if you define Marker 5 at an offset of 5MHz of Marker 1, and marker 1 is currently at 100MHz, then Marker 5 will be located at 105MHz. If Marker 1 moves to a different frequency later, Marker 5 will remain at 105MHz, you can see the current frequency offset any time in the marker display panel.
- Future upgrades will allow for optional dynamic markers where offset will be locked so Main Marker absolute frequency value can change accordingly to the Delta Marker.
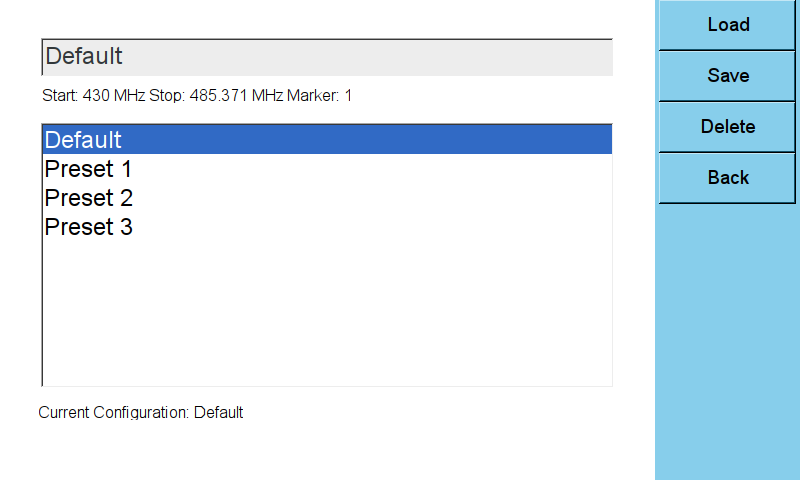
Presets
Presets are predefined configuration stored by name in the application to easily recall commonly used setups.
Parameters persisted are frequency, amplitude, enabled traces and markers.
Load
Action option to load stored preset values into current configuration.
Save
Action option to save current configuration into the selected preset. This option cannot be undone, care should be taken to not overwrite another valid preset.
Delete
Remove selected preset configuration. “Default” preset cannot be deleted.
Back
Return to main menu and current visual mode (Such as Spectrum Analyzer).
How to create a new preset
Notes
- For handheld models, these presets in the application are not the same presets as can be defined inside the device. A future version will include and help to coordinate both kinds: application and device presets.
- Load Presets only will be effective while device is capturing data, not when a file has been loaded.
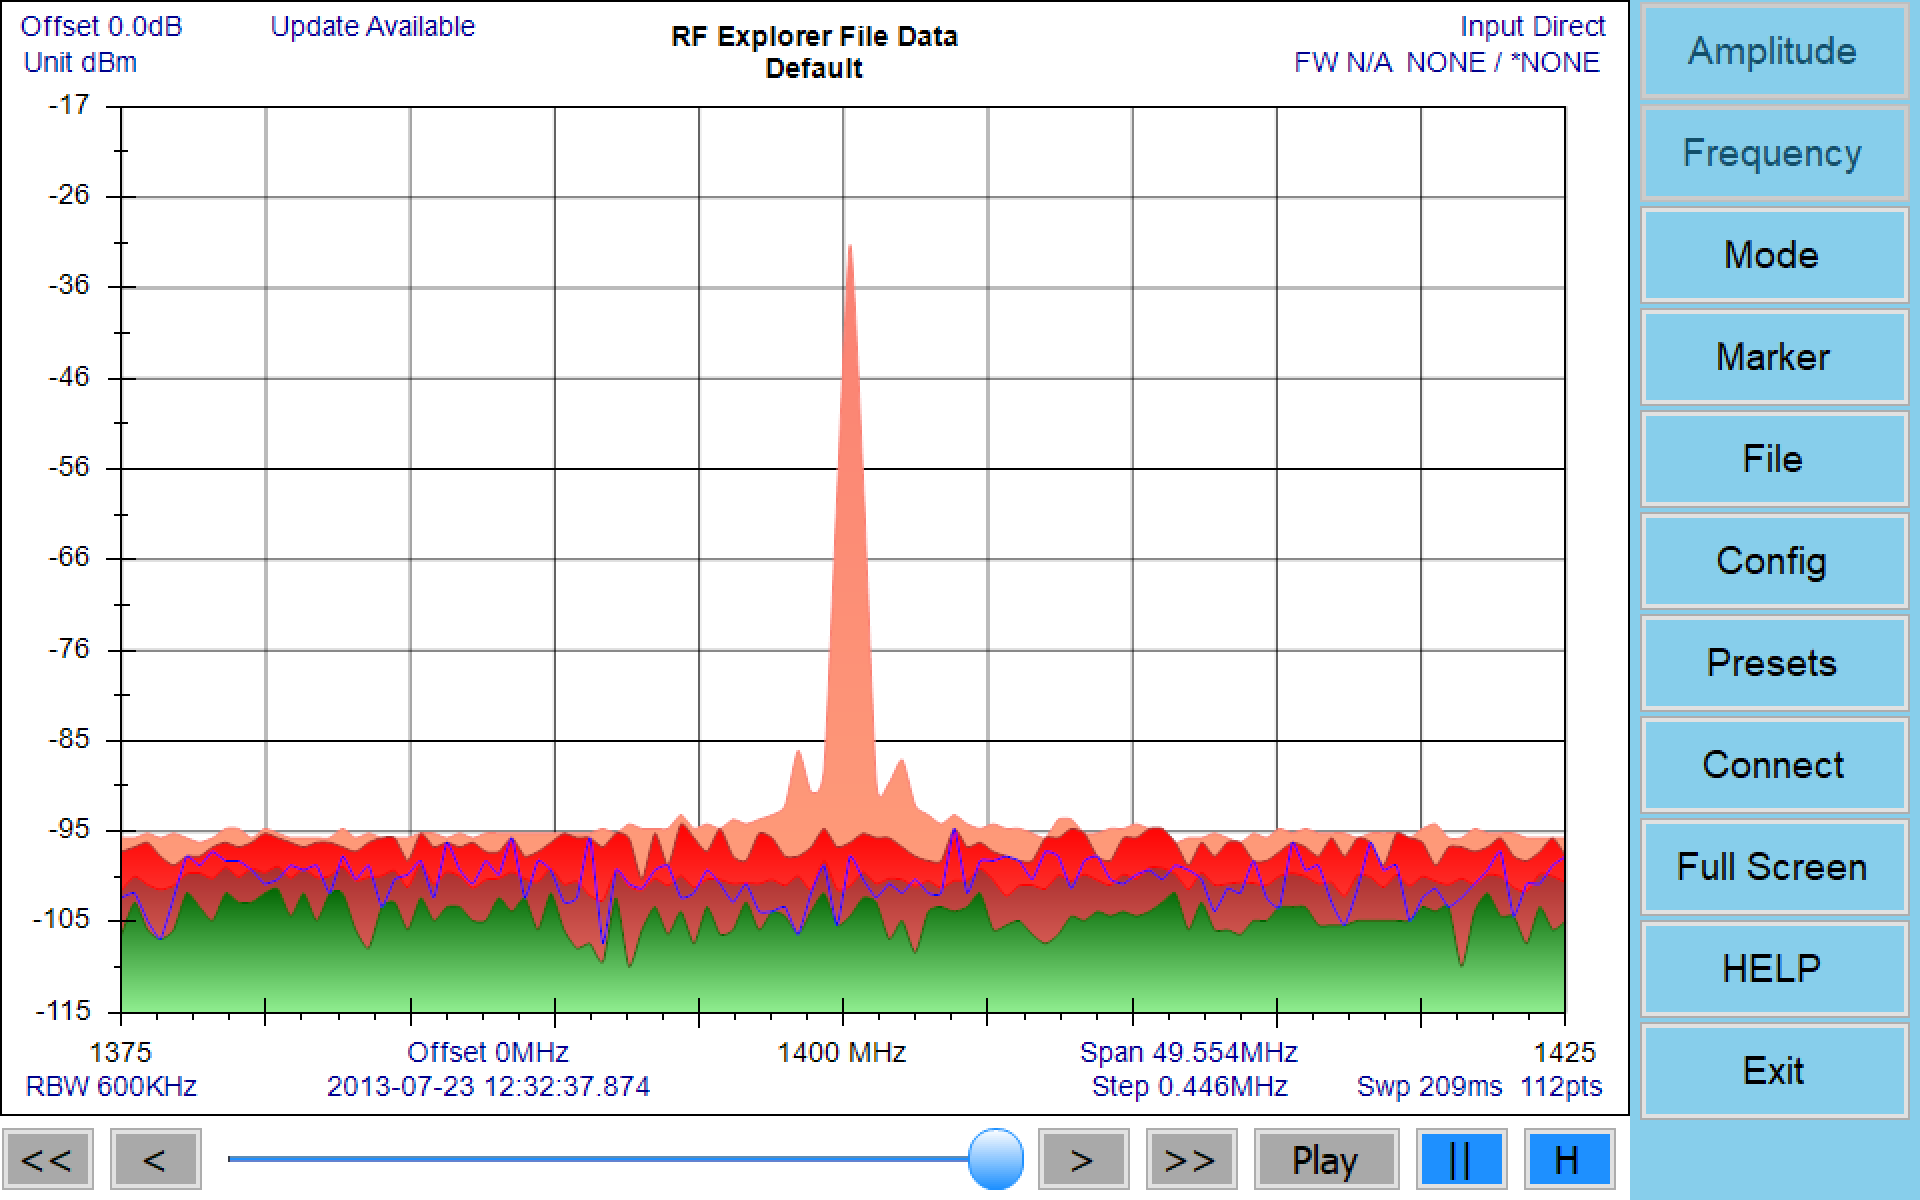
Files
Spectrum Analyzer mode
Contain different actions for files as Load, Save RFE data and Save CSV.
Overview
- RFE data files are binary, compact data files with multiple sweeps. These files are compatible with RF Explorer for Windows.
- CSV data files can capture a single trace and can be used to share data to external applications such as WWB, Excel, Matlab or IAS.
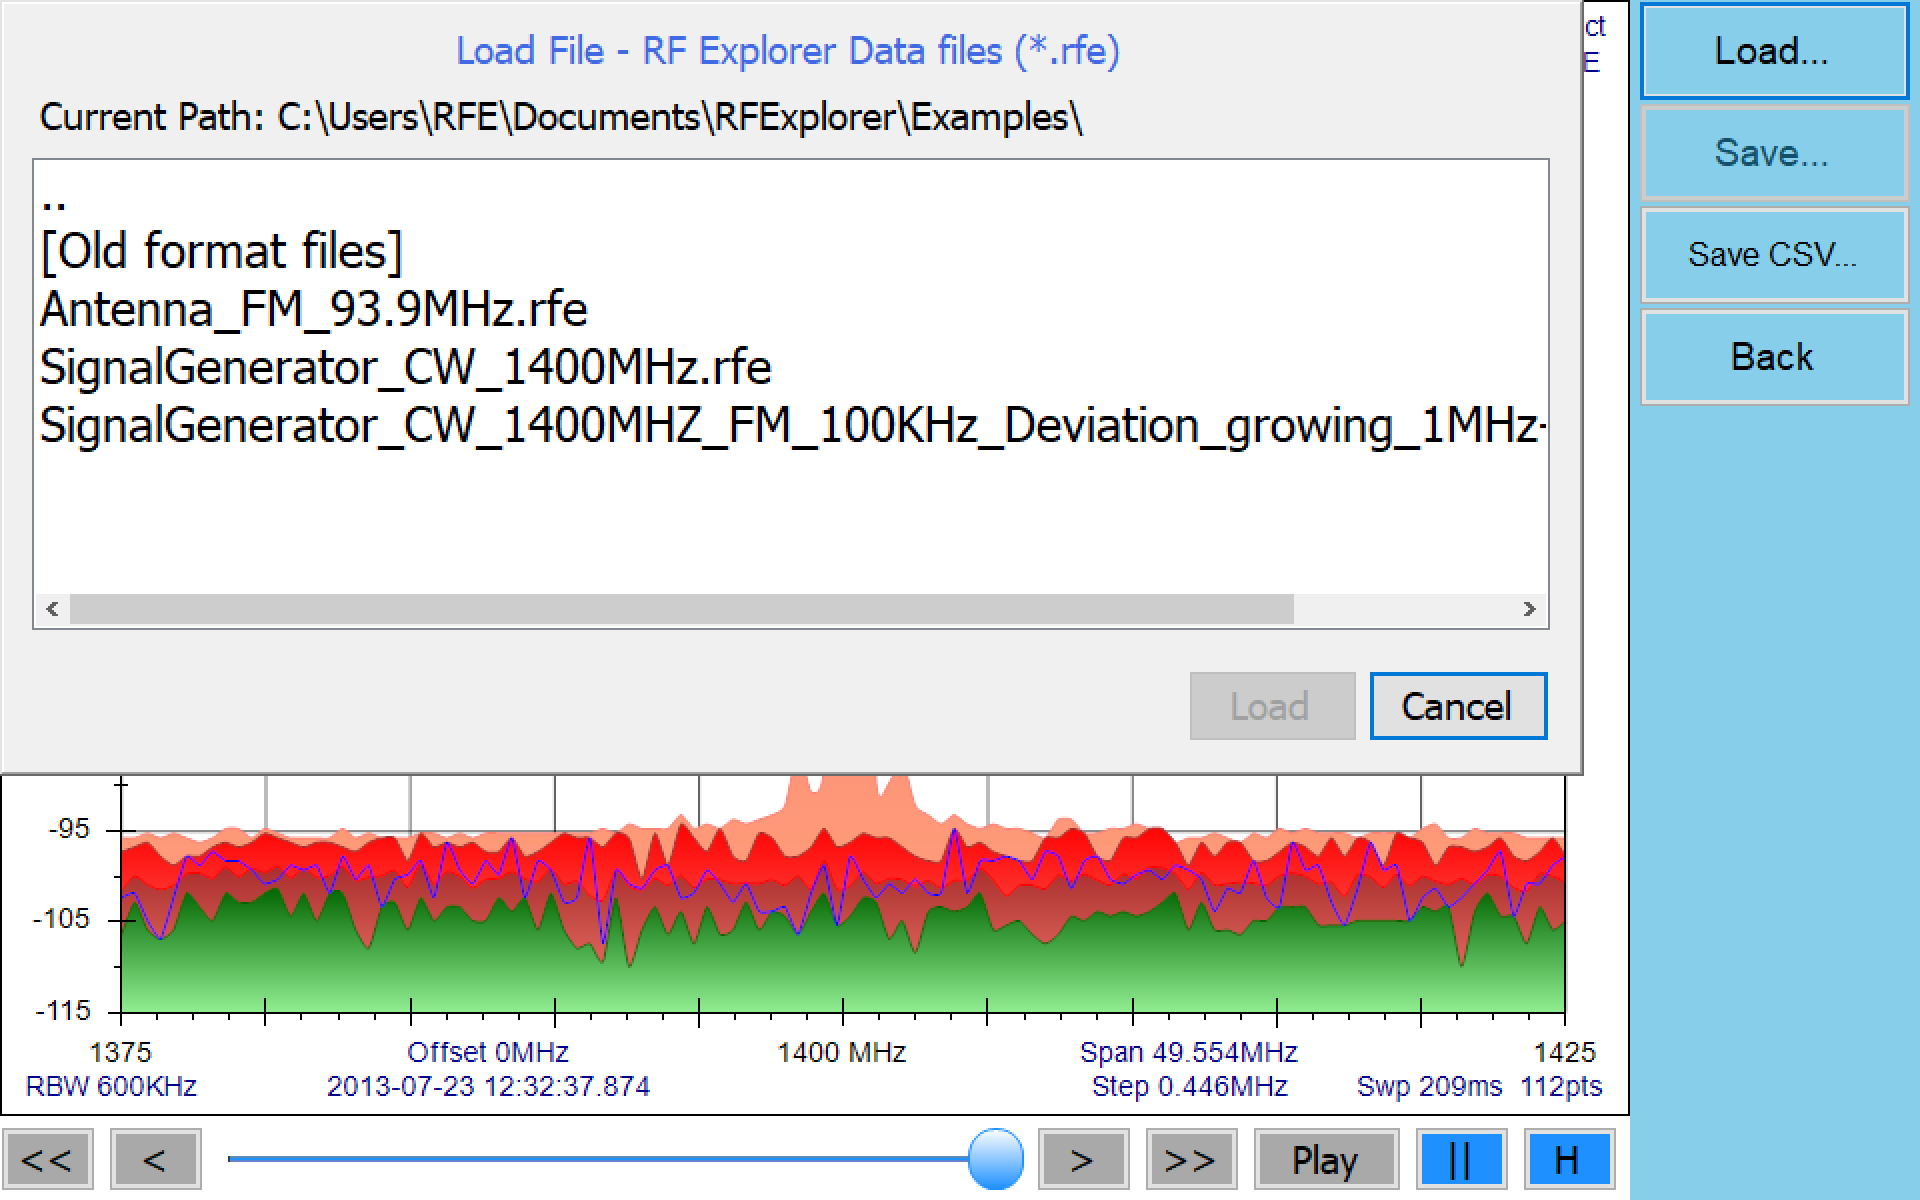
Load file
To load RFE file, go to File -> Load… and select desired file navigating through directories.
Click on [Load] button to finish action.
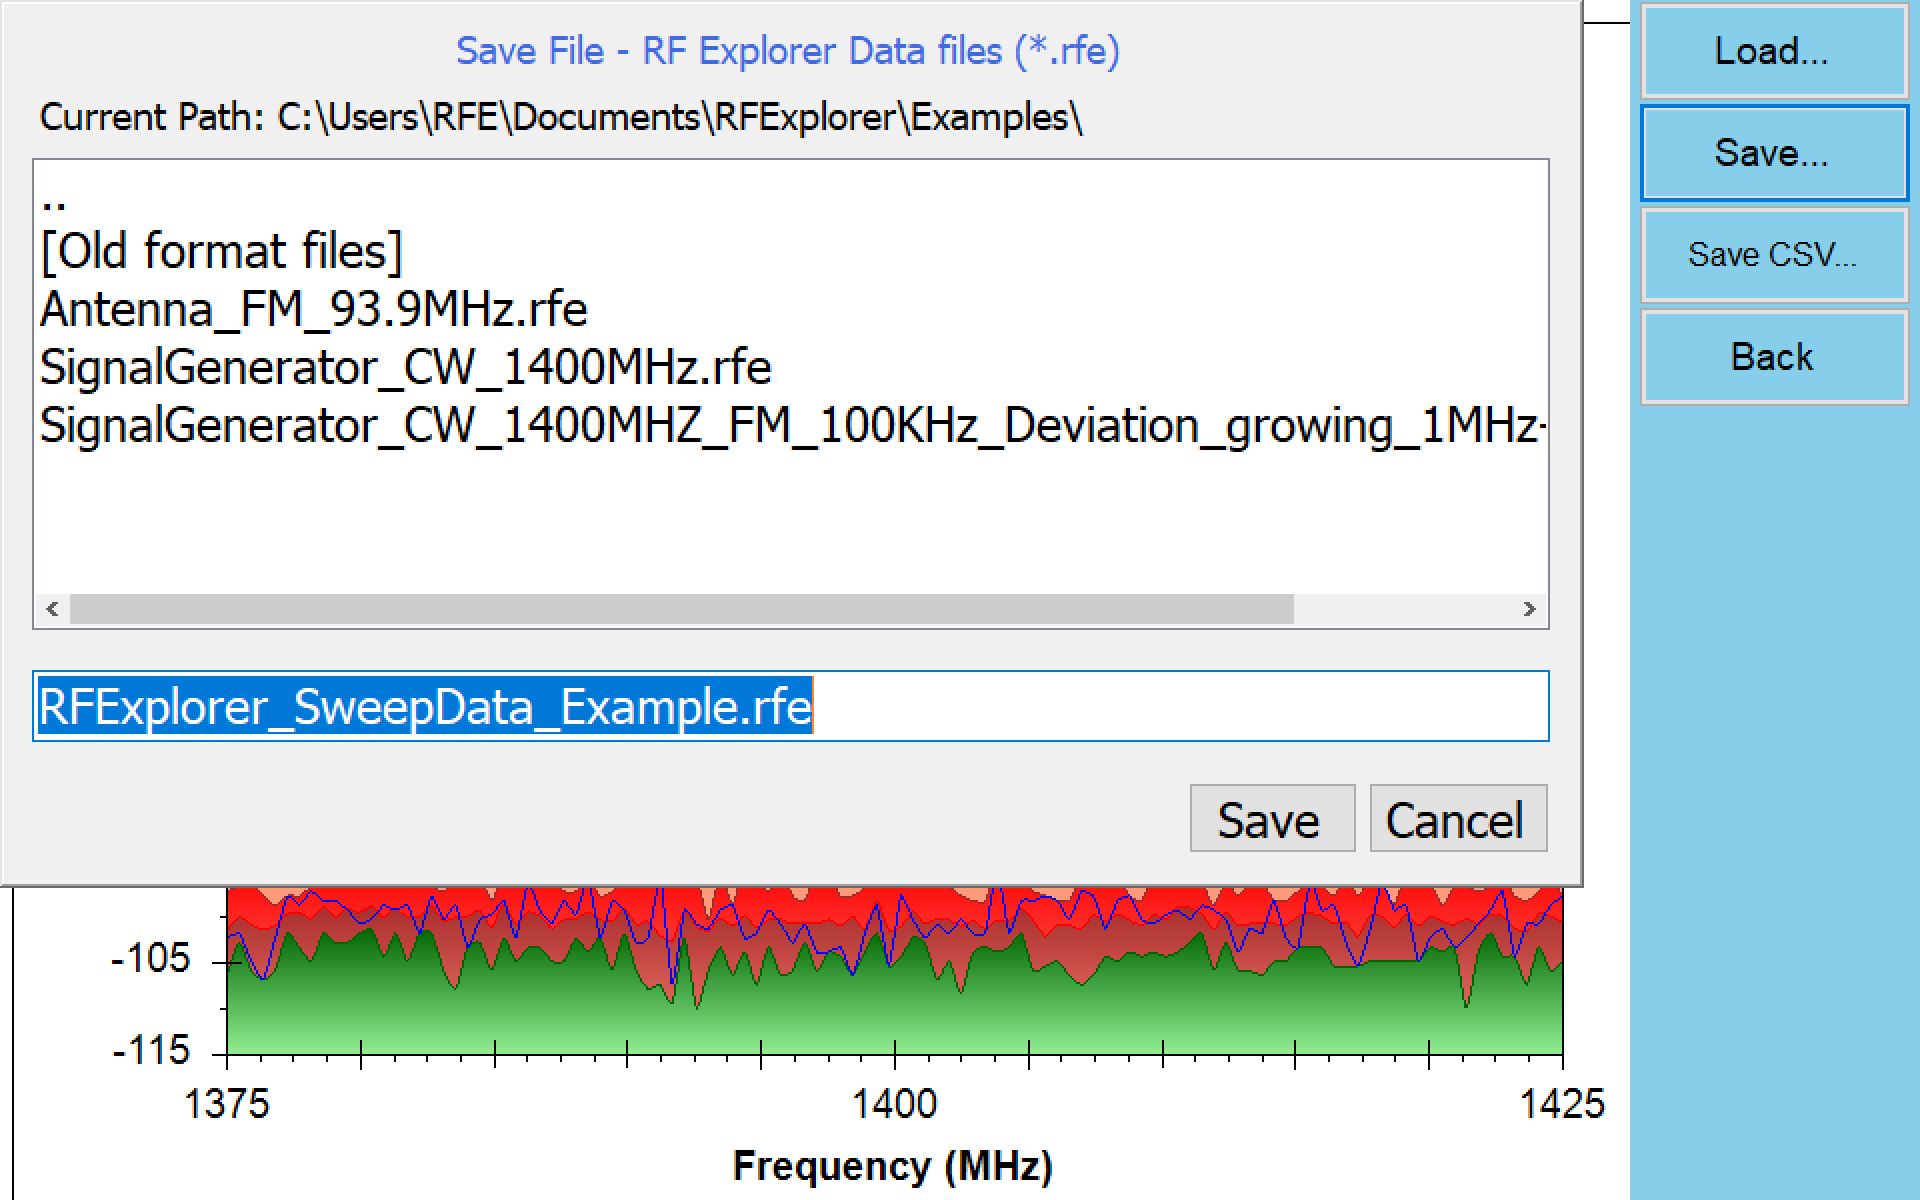
Save file
To save RFE file, go to File -> Save… and select desired directory to store file, typing a name for it.
Click on [Save] button to finish action.
This option is only available if there is a RF Explorer connected device and some data is actually received
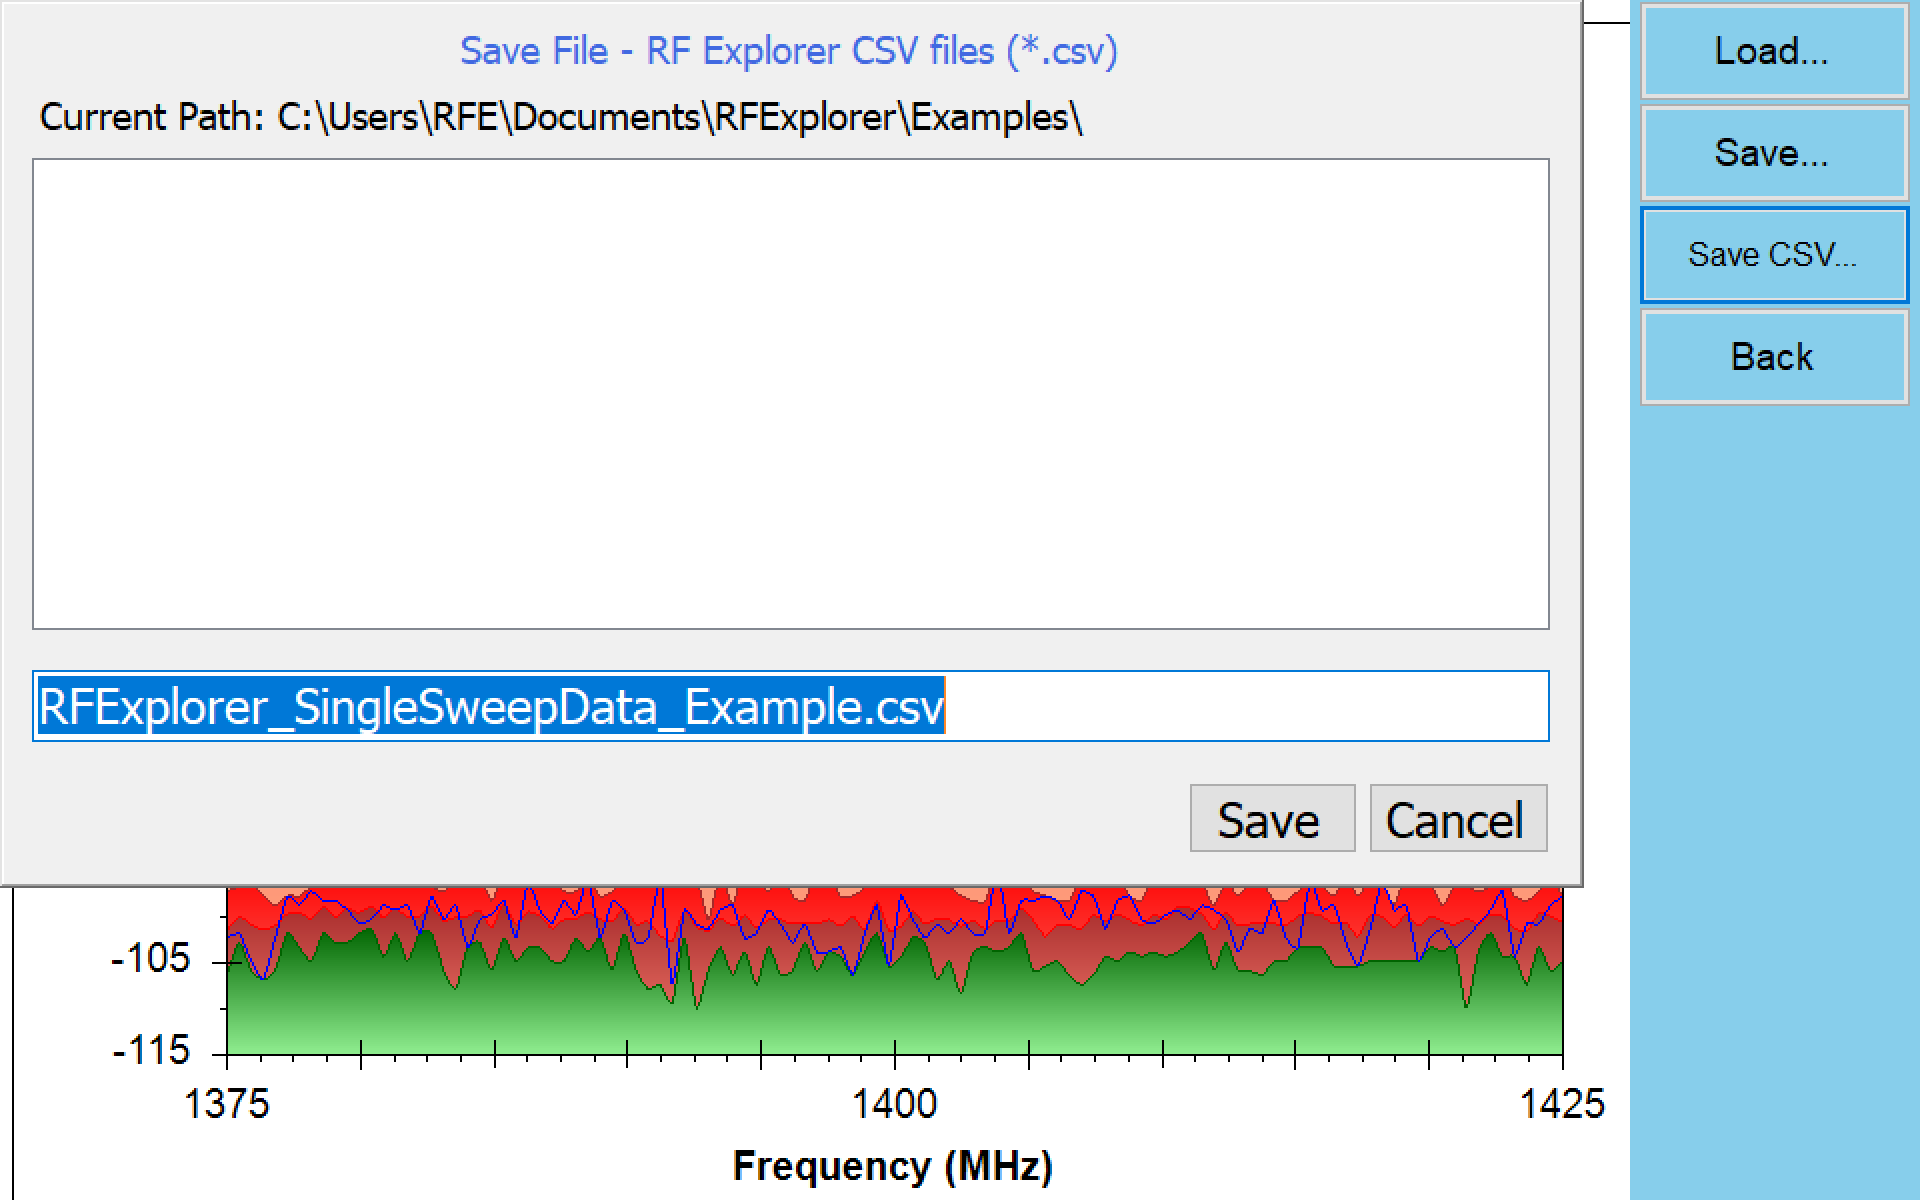
Save CSV file
To save single CSV file, go to File -> Save CSV… and select desired directory to store file, typing a name for it. Click on [Save] button to finish action.
To change CSV file configuration parameters, such as field delimiter or end of line type, see:
Instructions to easily export CSV files to external applications
Go to Config -> CSV File and check “WSM Sennheiser Compatible” option
Tracking SNA mode
Contain different actions for files as Load Normalization, Save Normalization, Save 1SP data and Save CSV.
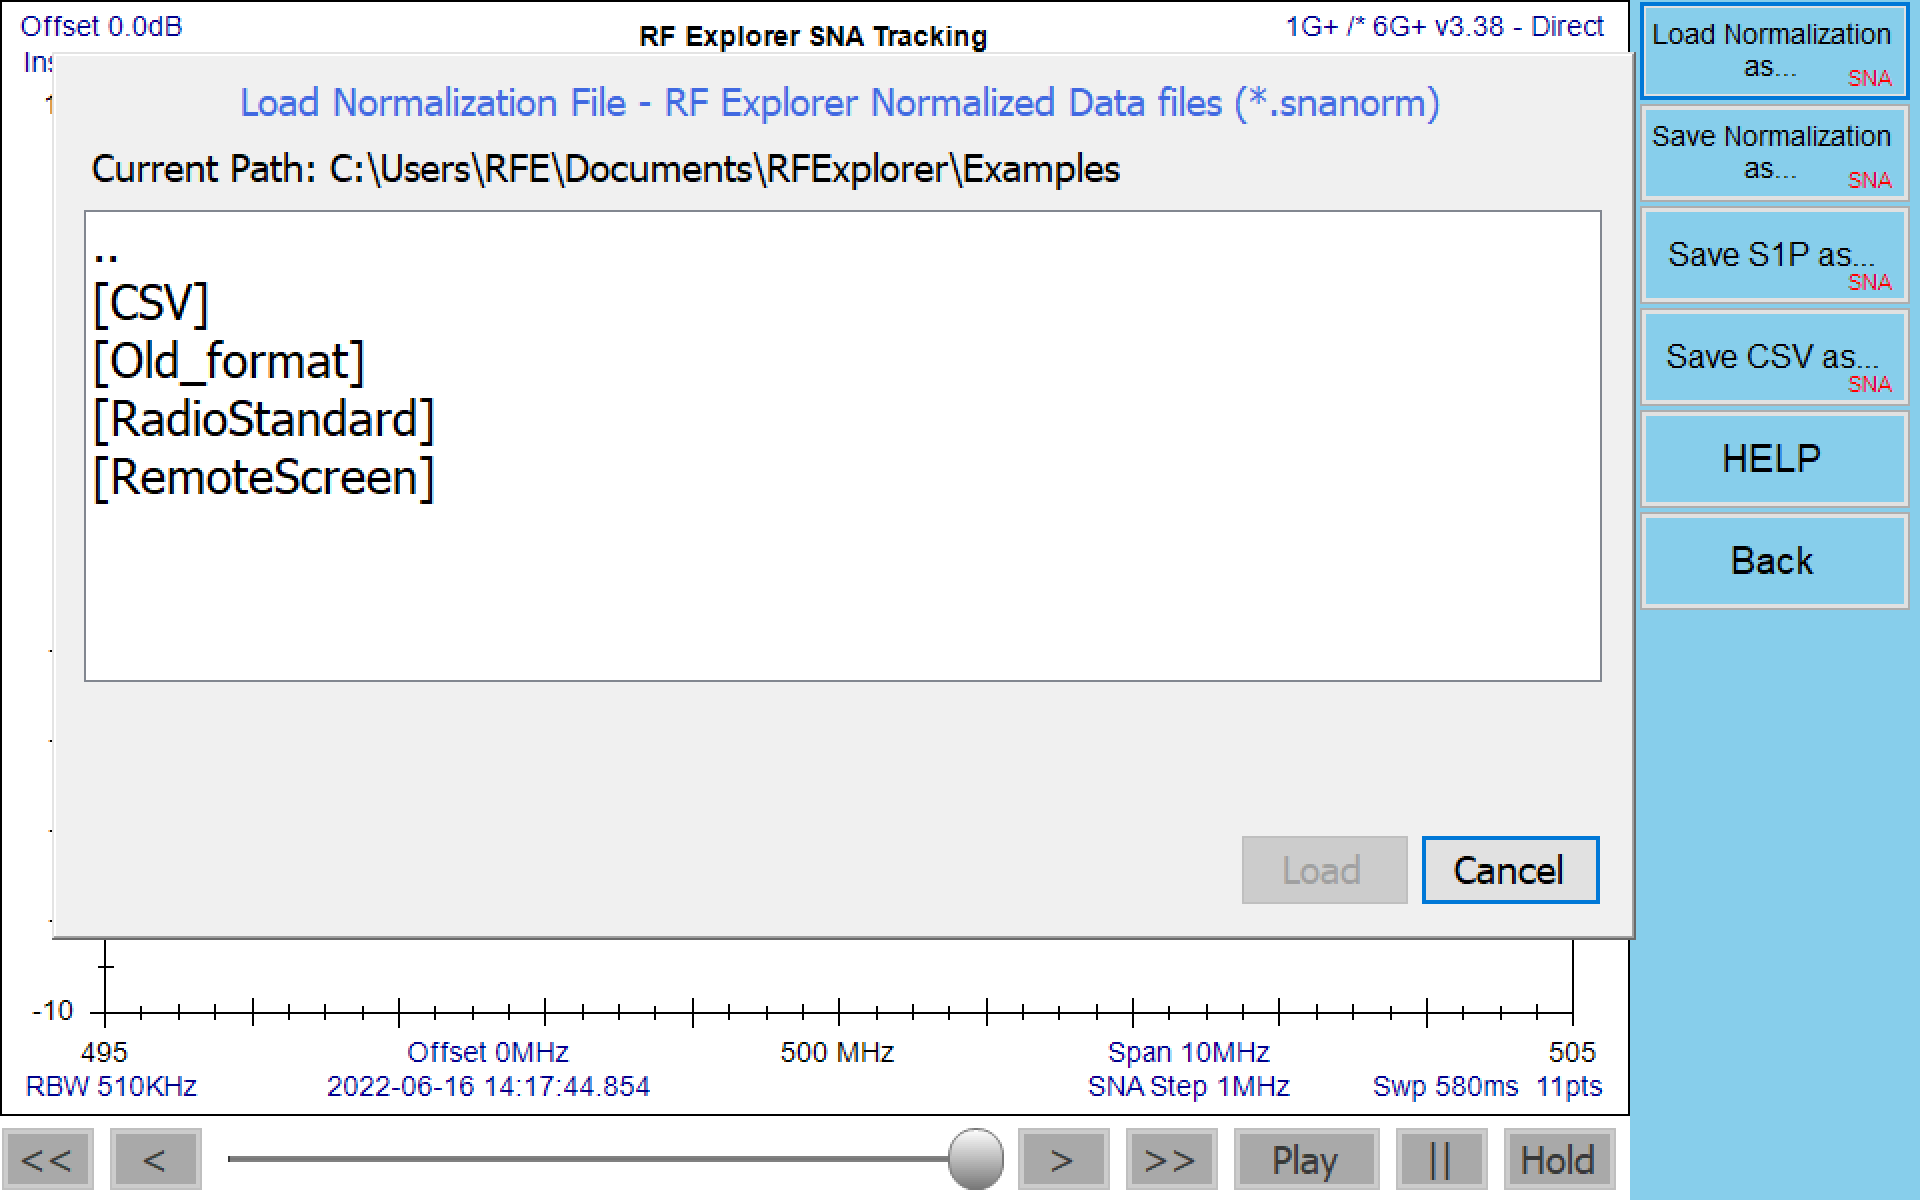
Load Normalization file
To load Normalization file, go to File -> Load Normalization as… and select desired file navigating through directories.
Click on [Load] button to finish action.
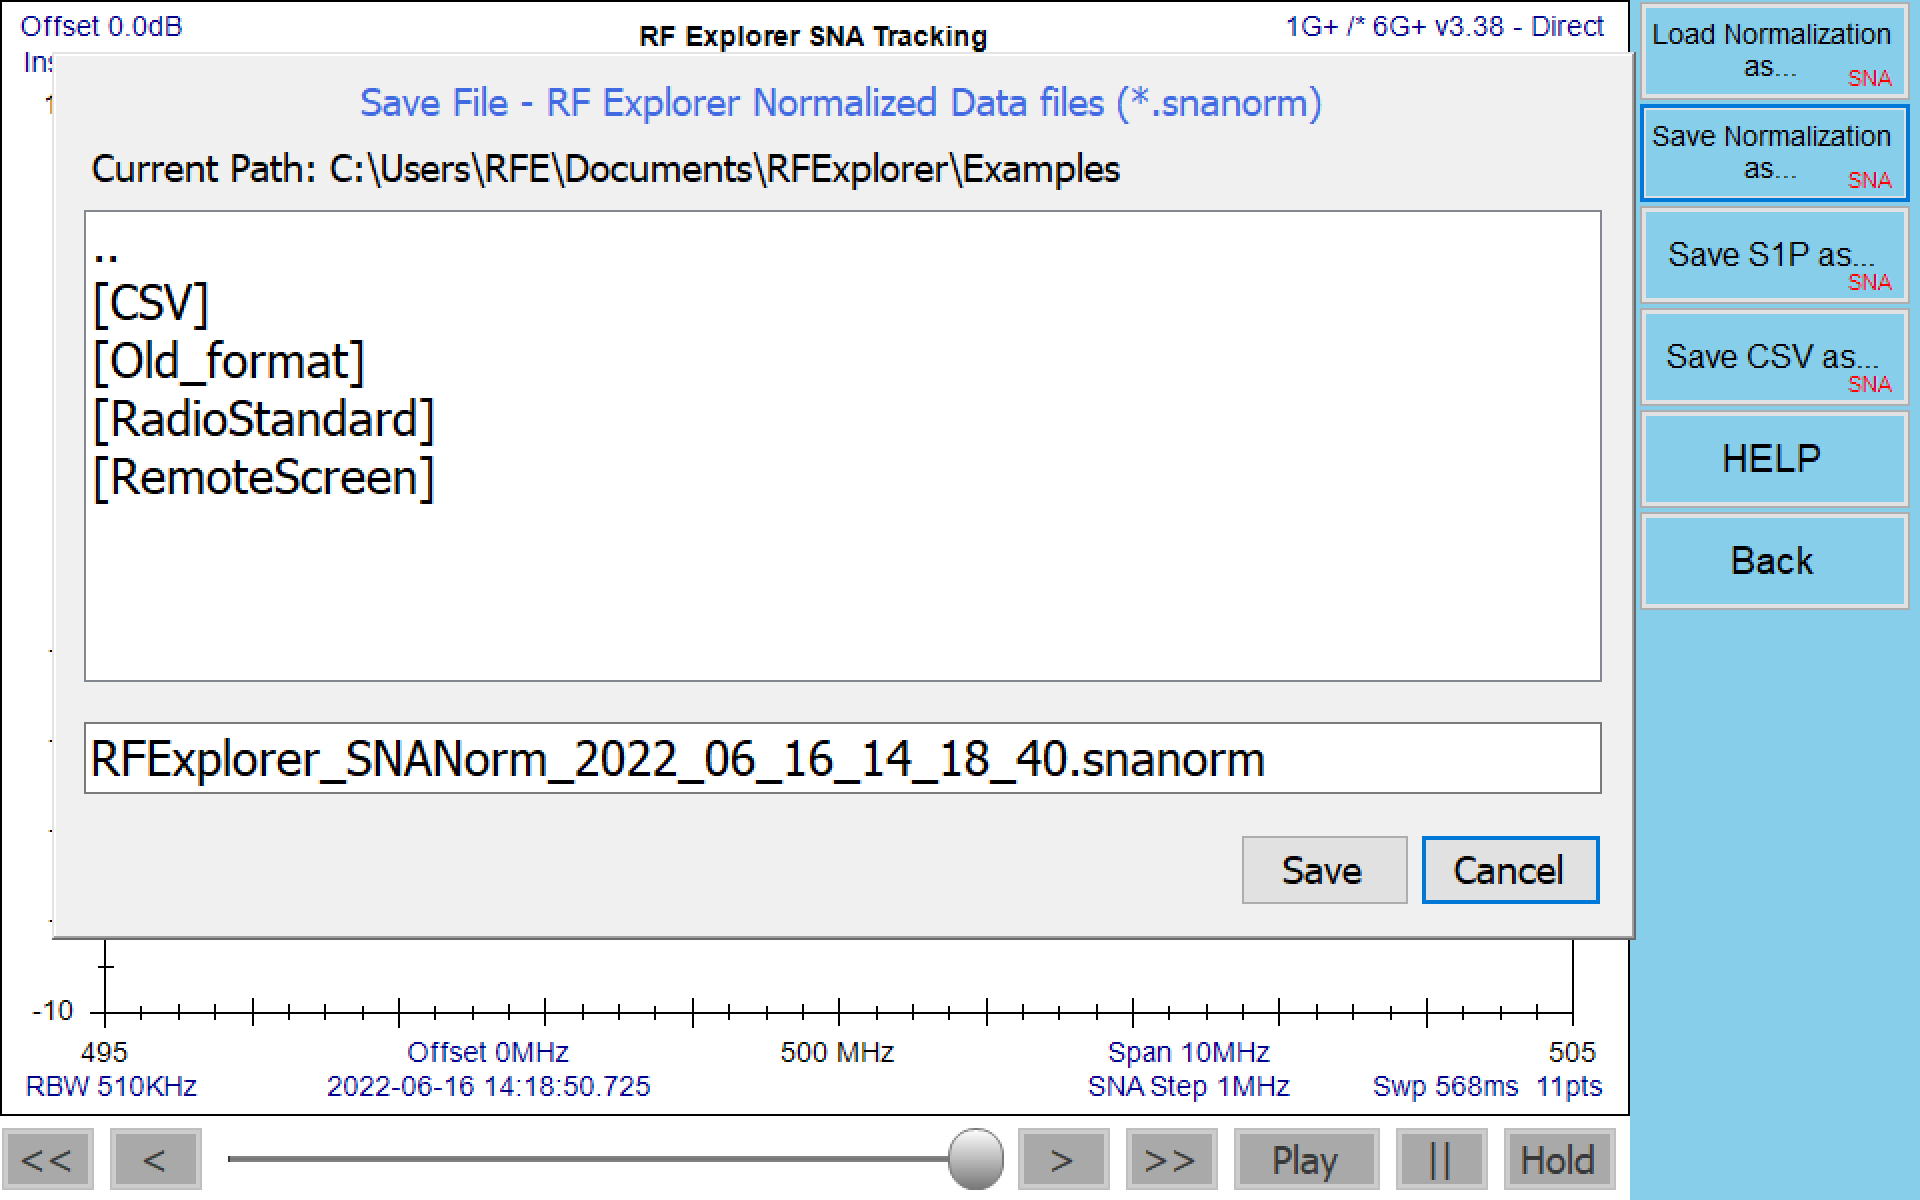
Save Normalization file
To save Normalization file, go to File -> Save Normalization as… and select desired directory to store file, typing a name for it.
Click on [Save] button to finish action.
This option is only available if tracking normalization data is actually received
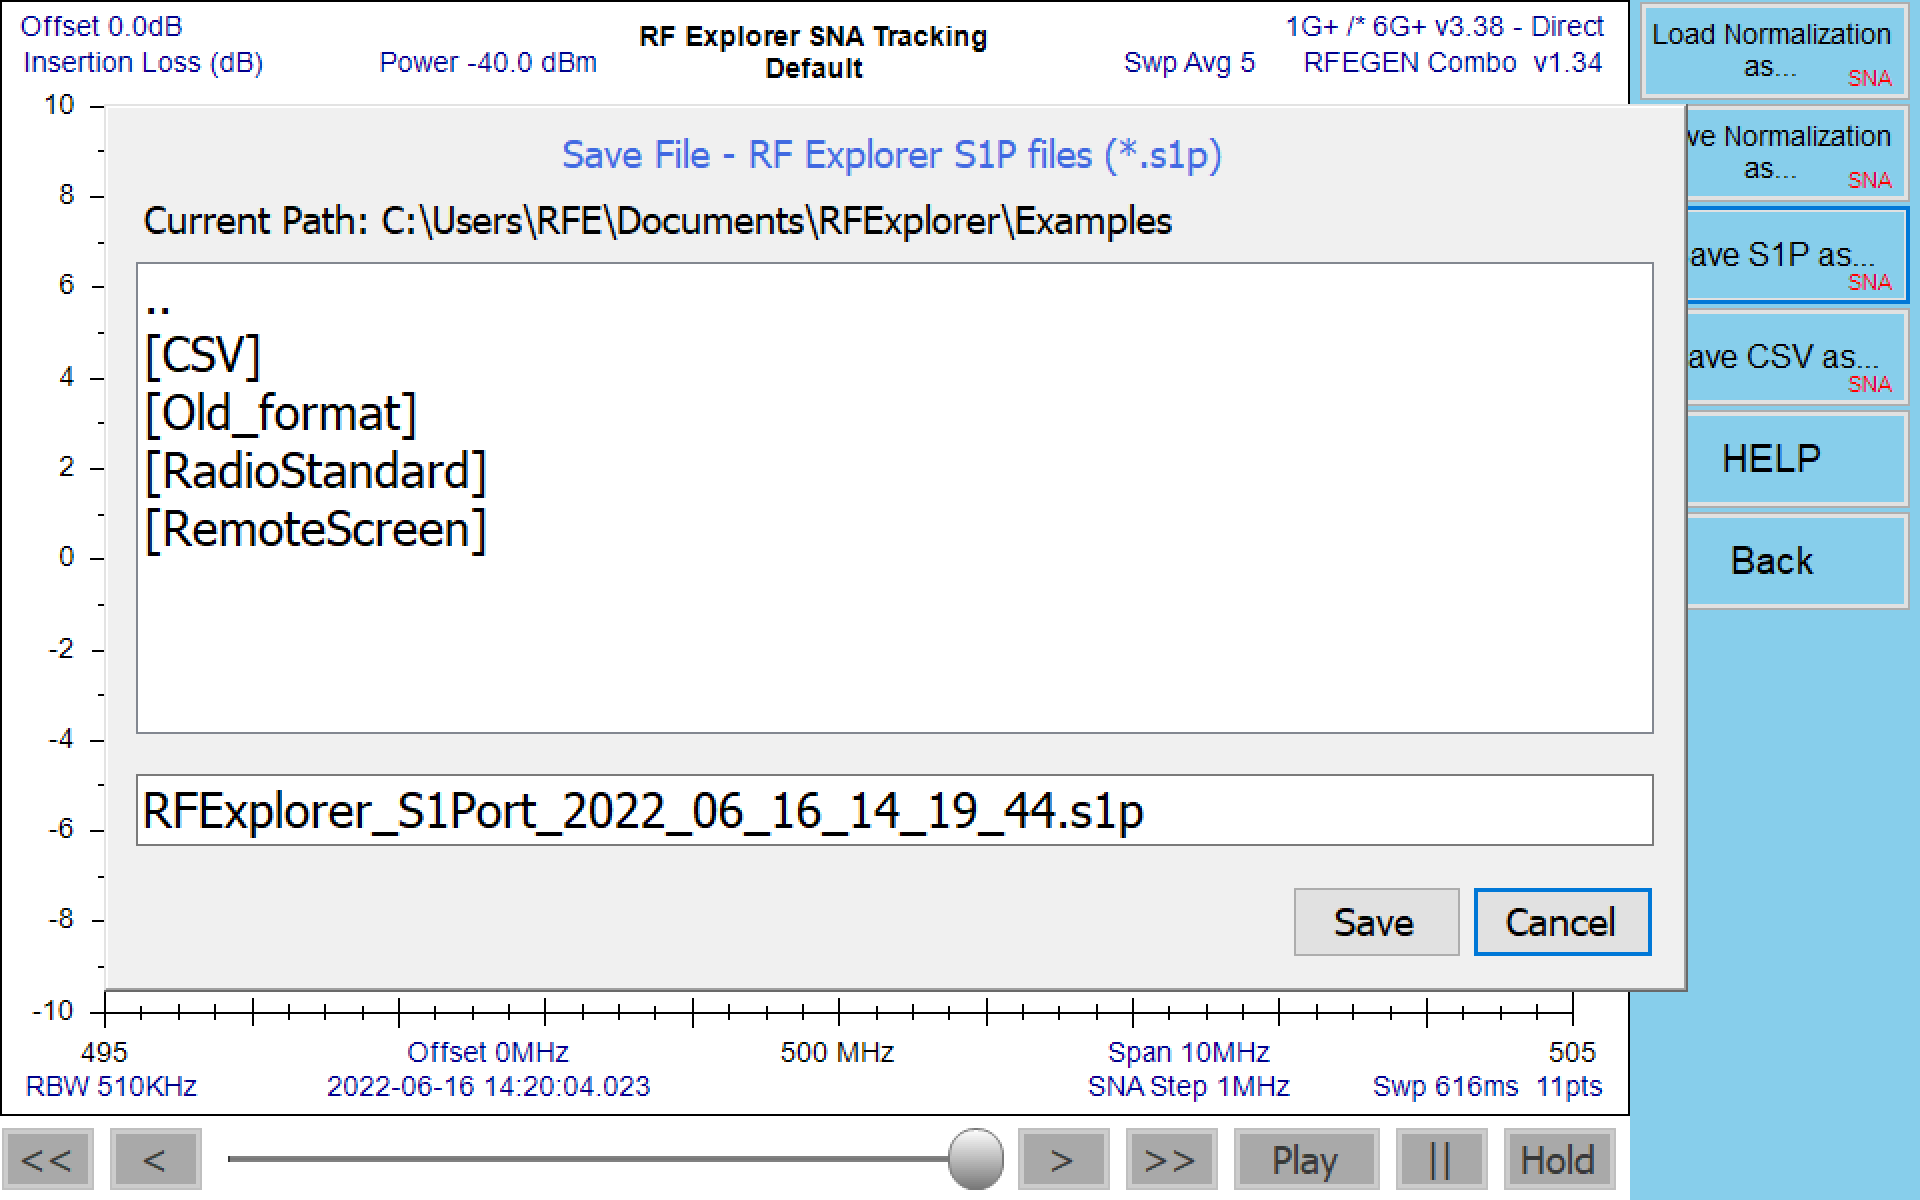
Save S1P file
One port S-parameter data file.
To save tracking S1P file, go to File -> Save S1P as… and select desired directory to store file, typing a name for it.
Click on [Save] button to finish action.
Save CSV file
To save tracking SNA single CSV file, go to File -> Save CSV… and select desired directory to store file, typing a name for it. Click on [Save] button to finish action.
To change CSV file configuration parameters, such as field delimiter or end of line type, see:
Virtual Touch Keyboards
In order to make it simpler to enter data in environments where a physical keyboard may not be available, these specific, context sensitive virtual touch keyboards are included in the RF Explorer Touch application.
Notes
- In Windows computers where a touch screen is detected, these keyboards will be enabled by default.
- In Windows computers where no touch capabilities are found, or in Linux and macOS computers, these keyboards will be disabled by default.
- These settings can be enabled anytime in Config/Display preferences.
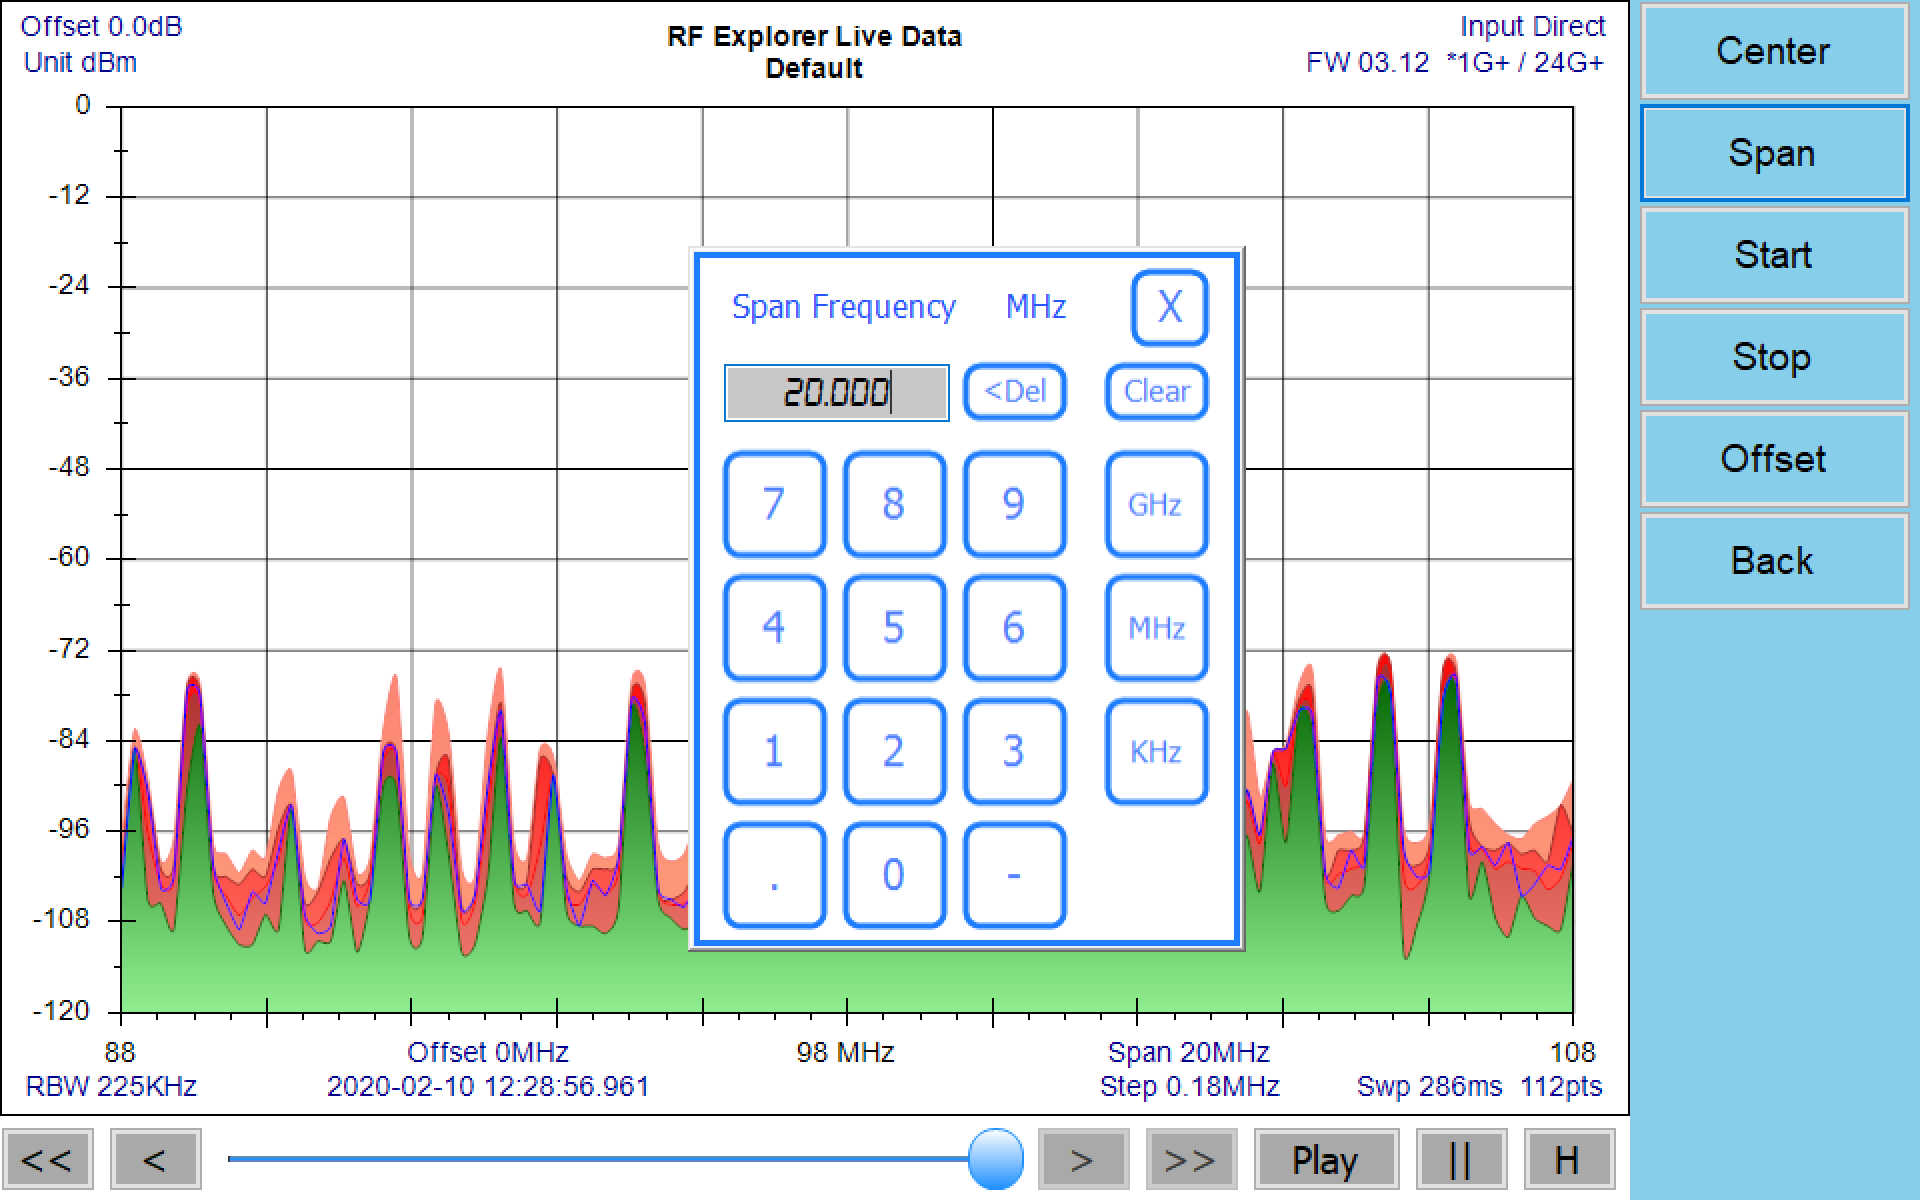
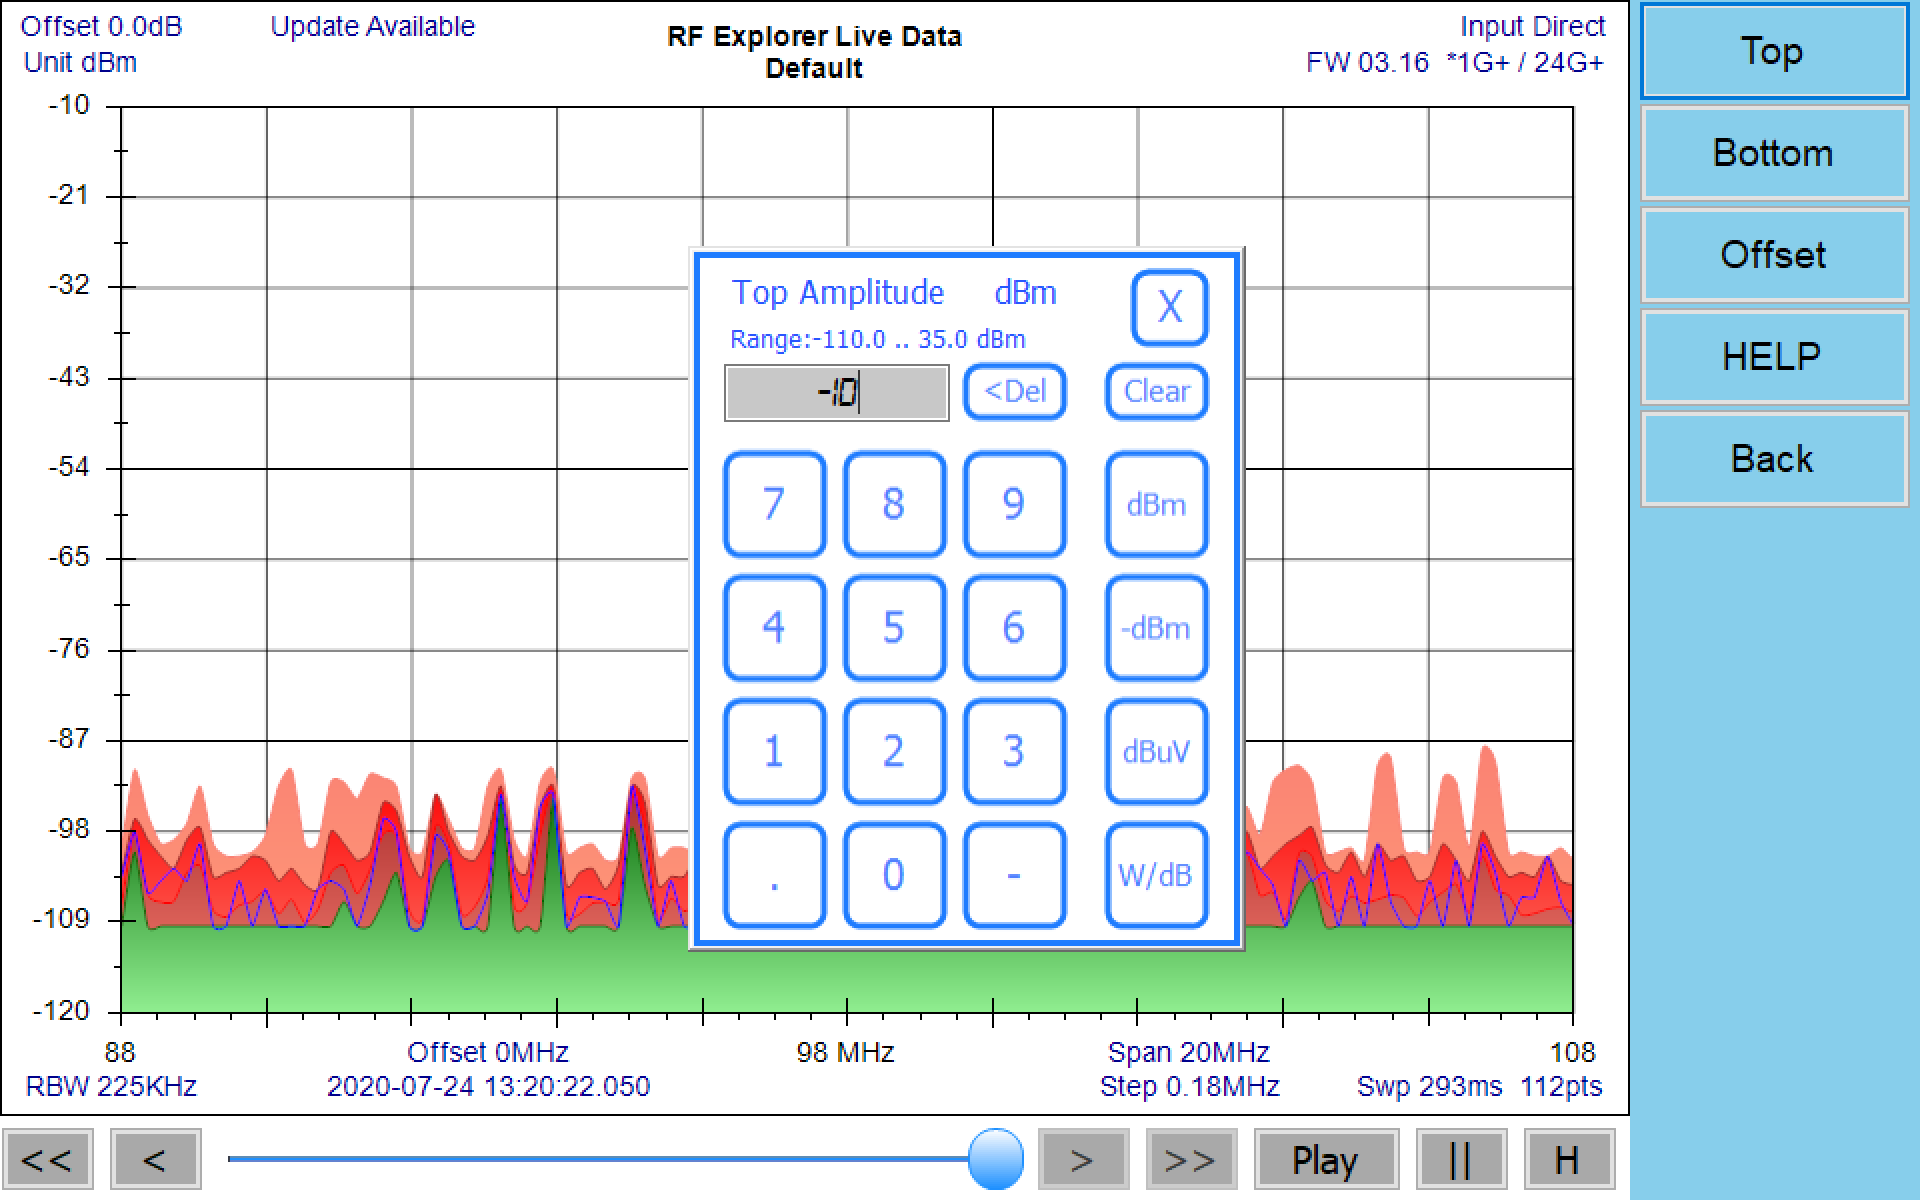
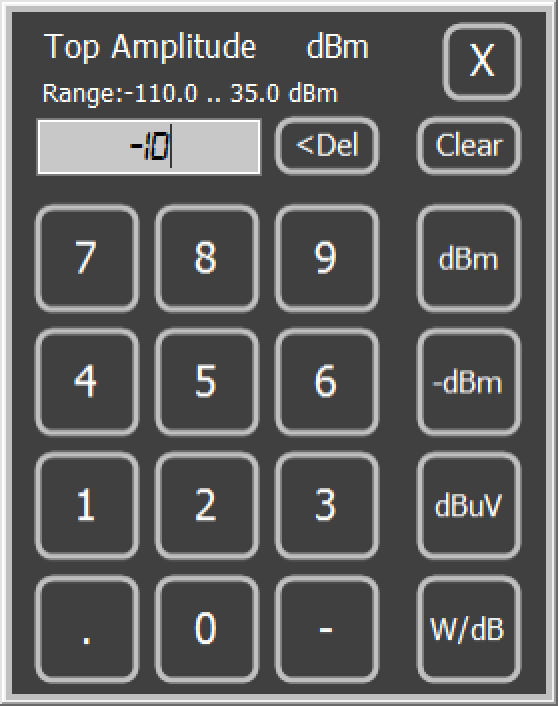
Numeric Keyboard
This keyboard will appear when application require numeric data. When available, a physical keyboard can be used to edit numeric value as well.
This keyboard can be shown/hidden based on Config/Display setting, except Amplitude and Frequency which are always available.
- [X]: Close keyboard ignoring changes.
- [<DEL]: Delete a left digit from current cursor position.
- [CLEAR]: Remove all text in edit box.
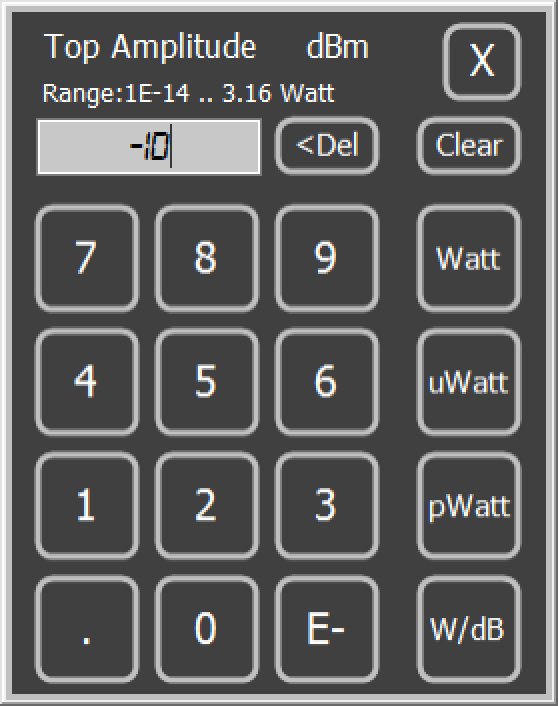
- [dBm], [-dBm], [dBµV], [Watt], [µWatt], [pWatt]: Validate inserted data in the specific units. Other configurations may show GHz, MHz, KHz, etc.
- [W/dB]: Switch amplitude units between dB and Watts
- Range label: Show current magnitude type used to enter value. For amplitude it may show dBm,.
Note
Validation buttons will change depending on parameter to modify.
Alphanumeric Keyboard
This keyboard will appear when application require text information. When available, a physical keyboard can be used to edit alphanumeric value as well. This keyboard can be shown/hidden based on Config/Display setting.
- [CLEAR]: Remove all text in edit box.
- [ESC]: Close keyboard ignoring changes.
- [CAPS]: Type with capital letters.
- [<DEL]: Delete a left character from current cursor position.
- [DONE]: Close keyboard saving typed text.
- [<]: Move cursor to the left.
- [>]: Move cursor to the right.

Advanced Configuration
Some advanced configuration settings are available for expert users tune-up.
This should be modified only if you are comfortable changing XML files and understanding XML syntax.
The advanced configuration parameters are stored in file RFETouch.xml. This file can be found in following locations depending on OS:
C:\Users\<username>\AppData\Roaming\RFExplorer
Note
Only these parameters described should be modified, other RFETouch.xml configuration parameters should not be modified.
Incorrect file update may damage XML structure or values and may lead to configuration loss.
It is advisable to backup the RFETouch.xml before any modification is made.
Parameter | Default | Values | Description |
|---|---|---|---|
IsIOTModule | true | true/false | Use true for IoT module, or false for Handheld Analyzer. This setting is set by default to true in Raspberry Pi SDCard image files, and false otherwise |
ShutdownRPiOnCloseApp | true | true/false | Use true to shutdown Linux when RFETouch is closed, other case set to false. This setting is set by default to true in Raspberry Pi SDCard image files, and false otherwise |
IoTPortName | /dev/ttyAMA0 | /dev/ttyAMA0 | For Raspberry Pi only: Set serial port name either as /dev/ttyAMA0 or /dev/ttyS0 depending on UART configuration (useful in Raspberry Pi 4B). This parameter is ignored for USB devices, only RF Explorer IoT module is affected by this setting in a Raspberry Pi. |
OpenGL support in Windows
OpenGL library and capable driver is needed to display Waterfall mode. You can disable OpenGL support if your driver card reports any problem by adding /o to the application shortcut
RFETouchWin.exe /o
Raspberry Pi: How to disable RFETouch auto-start
In SDCard images provided for Raspberry Pi, the RFETouch application is configured to automatically start after the Raspbian GUI is loaded.
If you want to disable this behavior and load RFETouch manually, locate the autostart configuration file which may be in one of the following locations, depending on Raspberry Pi model:
- /home/pi/.config/lxsession/LXDE-pi/autostart
- /etc/xdg/lxsession/LXDE-pi/autostart
Edit this file using <sudo nano> or equivalent editor as superuser, and remove this line:
@lxterminal -e sudo /home/pi/RFExplorer/RFETouch
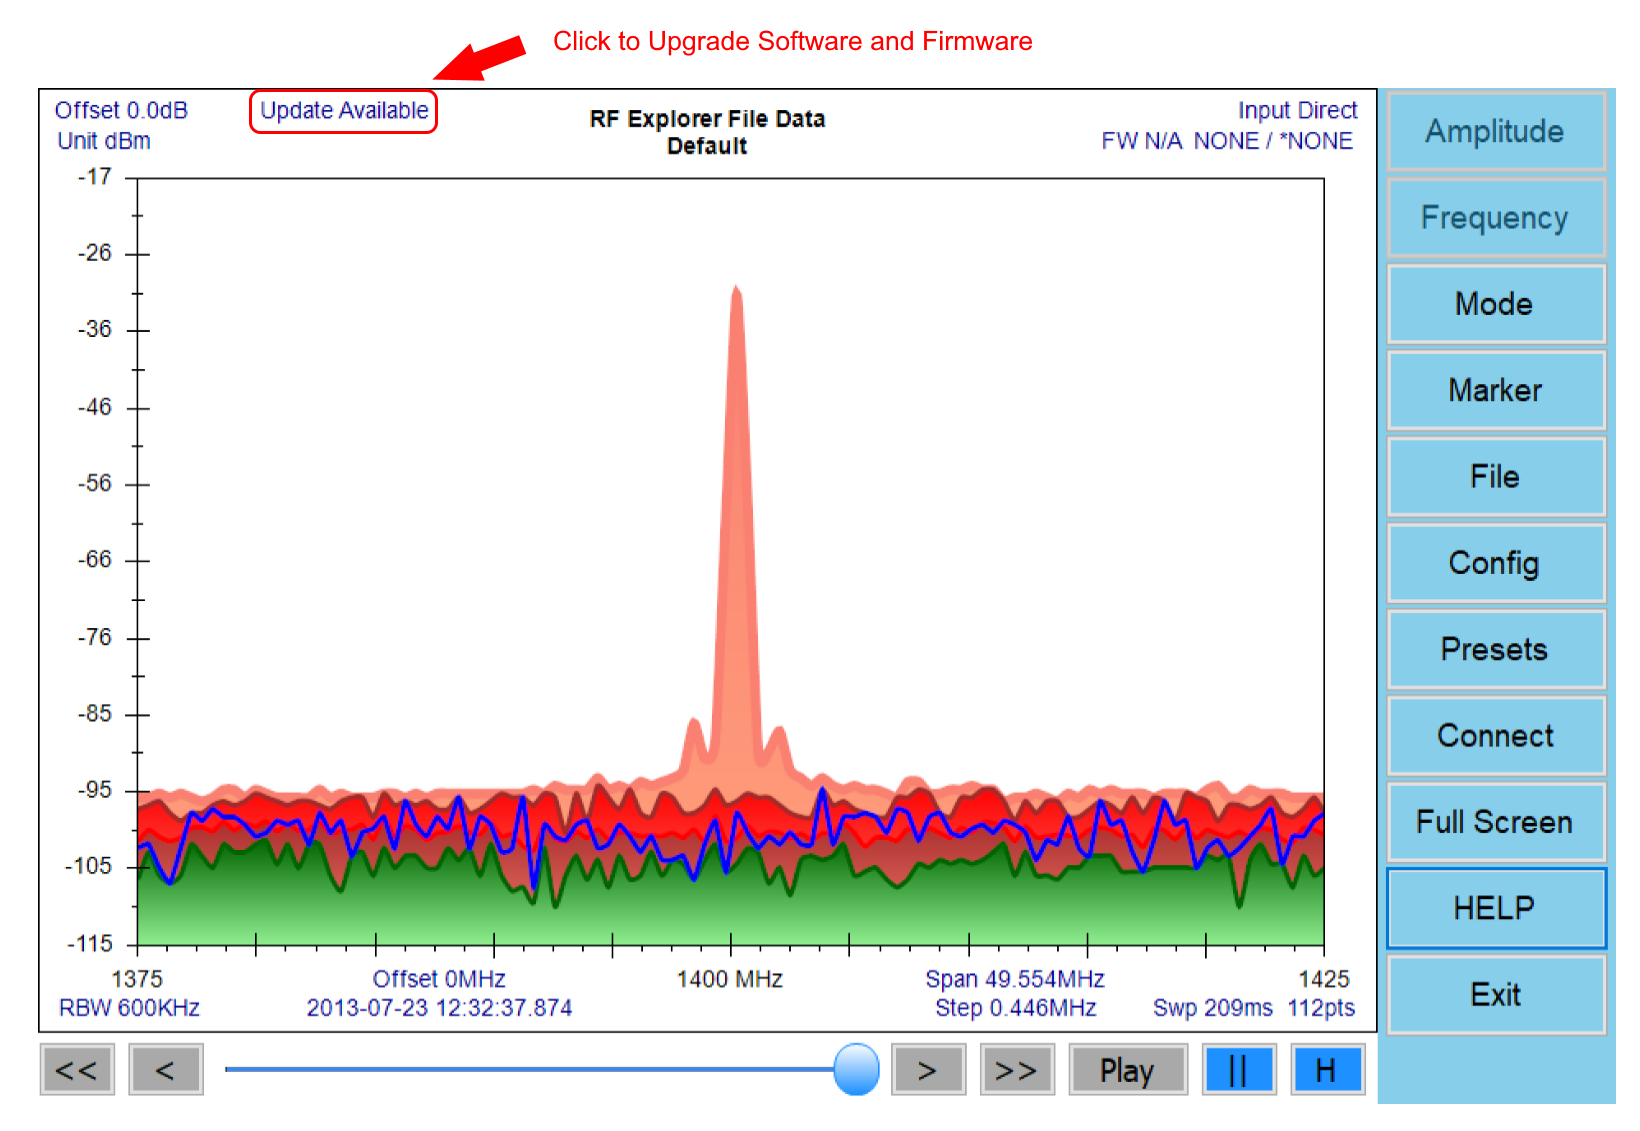
Software and Firmware Online Upgrade
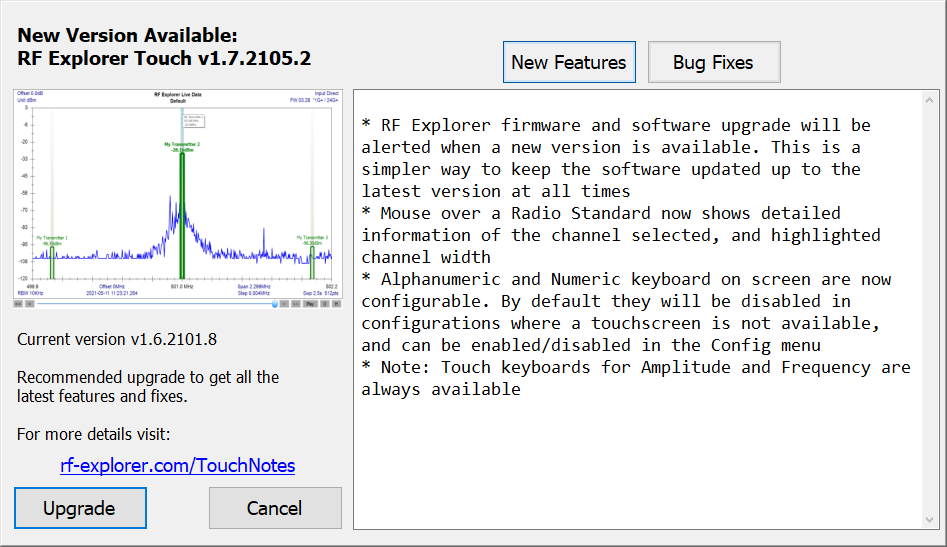
RF Explorer Touch software check every time it is started if a new software version or connected device firmware version is available to upgrade from our online secure server.
If a software or firmware upgrade is available, label “Update Available” will display on Spectrum Analyzer graph or the first time CONFIG menu is entered.
How to upgrade your current software version
Note
In Windows platforms this is automatic process, whereas in Linux the new version is downloaded at ~/Downloads/RFETouchSetup and requires user to replace manually.
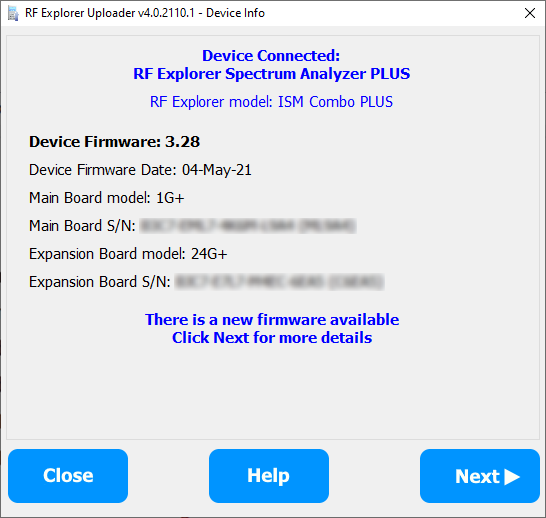
How to upgrade your current firmware version
Note
This only works when a RF Explorer device is connected to USB and active.