
Directional couplers are very useful devices, in particular we can use them for two major goals in measurement lab:
- Characterize return loss / impedance matching / VSWR
- Measure output power and reflection in real application circuit
For an example of return loss measurement process, check How-to: SNA Measuring Reflection - Return Loss.
Good directional couplers are expensive devices, but in many cases lower cost devices can produce good enough results on limited, reduced frequency ranges. The main topic of this article is how to get the most convenient directional coupler for a particular application, at the lowest possible cost. By understanding what are relevant parameters and how couplers work, we can save time and budget.
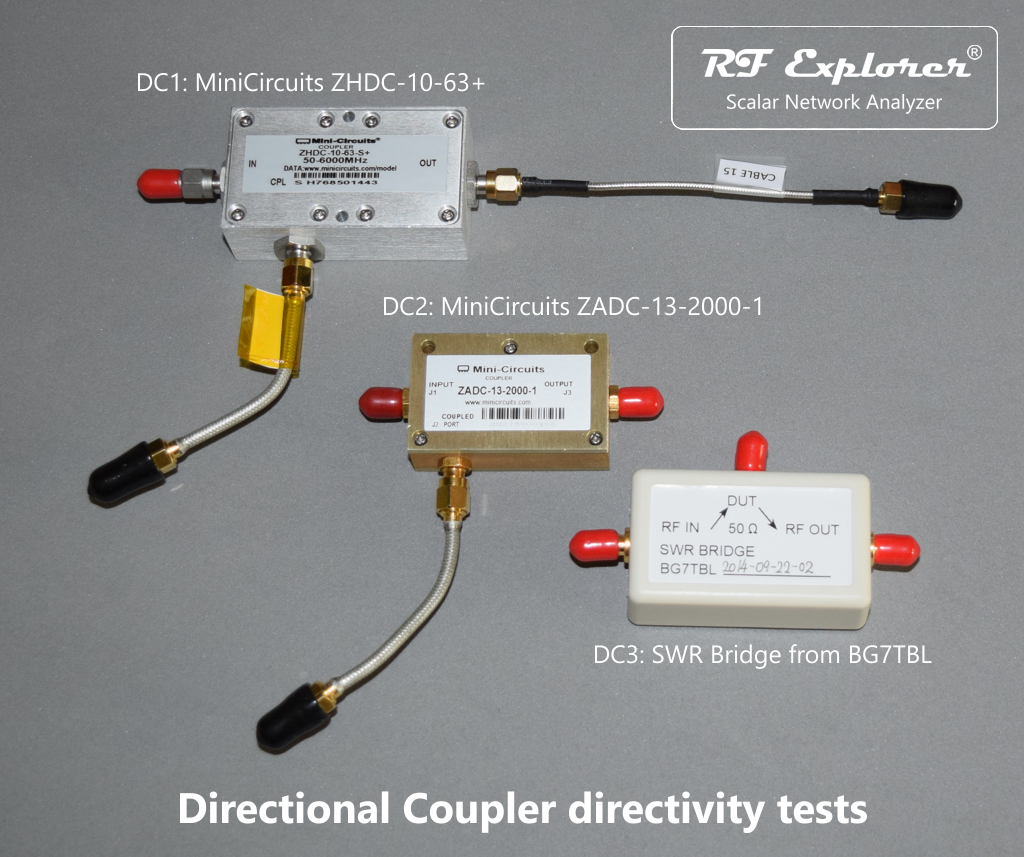
We are comparing these three couplers.
DISCLAIMER: every coupler is an unique device that may not perform exactly the same as other of the same model, due to tolerances. Manufacturers typically describe minimum and typical values for most critical parameters, and in most cases you need to really test an unit to know how it performs. We cannot guarantee a device of the same manufacturer and model will perform exactly the same as the ones tested here.
The single most important parameter in a directional coupler used for reflection measurement is the Directivity. This parameter should be in these ranges to be useful:
- 10dB minimum for any minimally indicative measurement, no accuracy expected
- 20dB minimum for reliable measurement
- 30dB or larger ideal for measurement of well-matched devices
What makes Directivity interesting is the fact that changes with frequency. You cannot expect a directional coupler to have a constant directivity at all frequencies. Even the most expensive ones used for instrumentation have directivity variations among frequency range. That is the reason why a directional coupler will be usable to measure reflection over a limited frequency range. Normally the wider the range and higher the directivity, the higher the price too.
In this article we will compare three devices of very different price, as a practical example, and explain how directivity plays a role so the best price/performance compromise can be made.
- DC1 – MiniCircuits ZHDC-10-63-S+
- DC2 – MiniCircuits ZADC-13-2000-1 or ZNDC-13-2G+
- DC3 – Hobby SWR Bridge from BG7TBL (google for more details)
This table compare performance among them
| DC1 | DC2 | DC3 | |
| Price | $295 on Minicircuits shop | $25 on eBay, $50 on Minicircuits shop | $25 on eBay |
| Model | ZHDC-10-63-S+ | ZADC-13-2000-1 / ZNDC-13-2G+ | BG7TBL |
| Freq range for Directivity >= 30dB | 200-6000MHz | 1200-1500MHz | 25-1200MHz |
| Freq range for Directivity >= 20dB | 50-6000MHz | 800-2000MHz | 25-1600MHz |
Other parameters of couplers are not so important for reflection measurement and therefore we will ignore them for the sake of simplicity.
Measure Coupler DC1 Directivity
We will use RF Explorer SNA to measure directivity of these couplers. This same process can be used to measure the directivity of any directional coupler with unknown directivity, or to check the directivity described in the datasheet is correct.
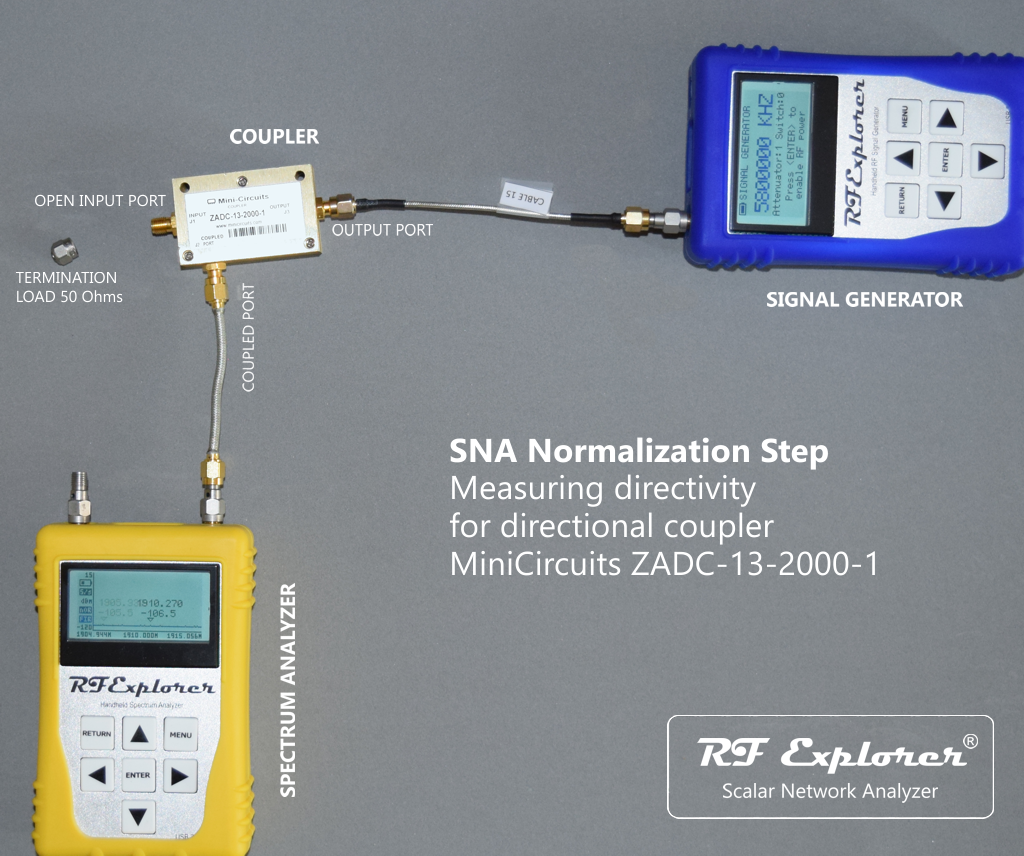
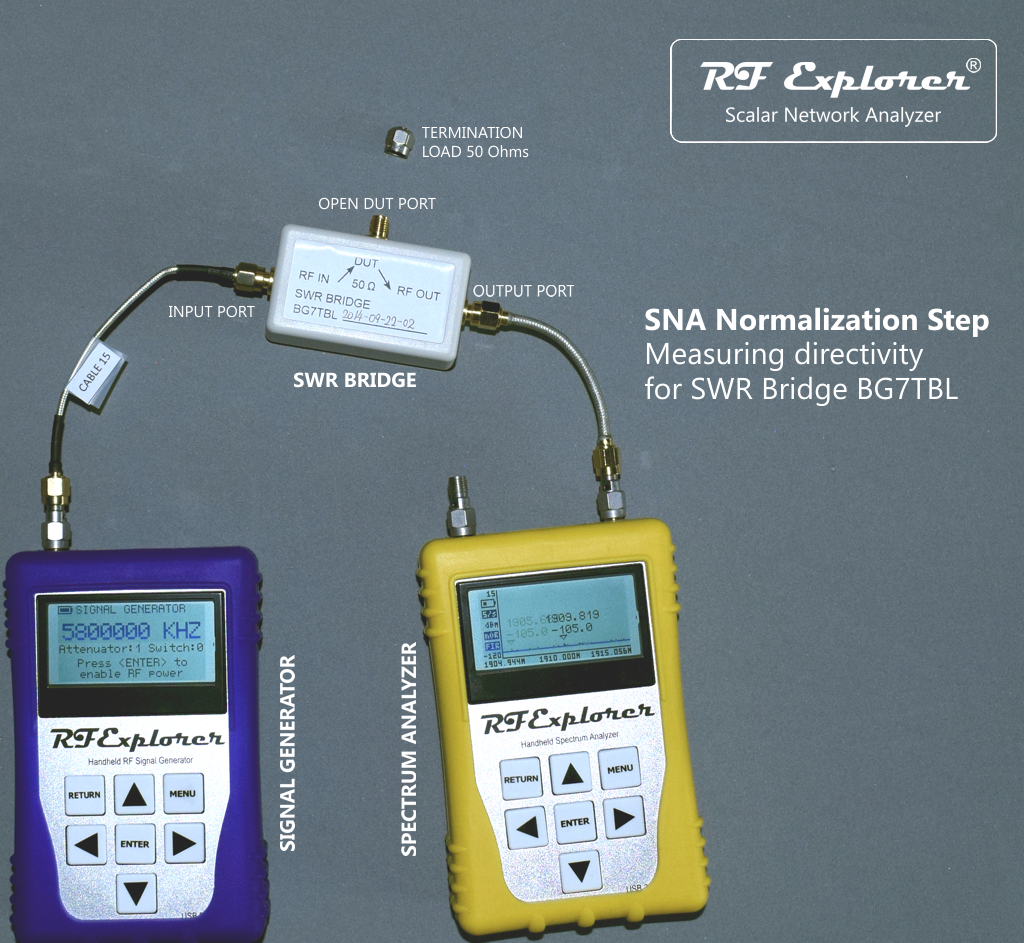
The first step is to normalize the SNA using RF Explorer Spectrum Analyzer and Signal Generator connected to the directional coupler with the INPUT open.
Connect RF Explorer Signal Generator and Spectrum Analyzer as depicted below and then to the PC with USB cables. On the PC load RF Explorer for Windows and define frequency range you want to test the coupler for. Then click on [Normalize SNA].
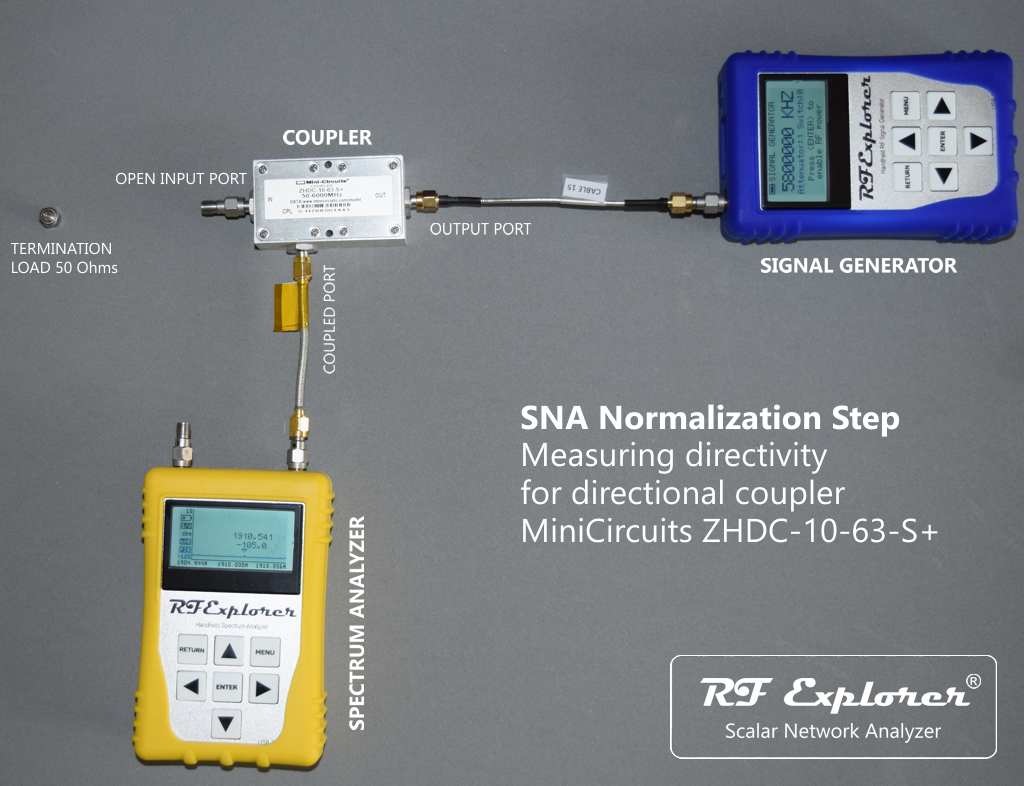
With this step completed, RF Explorer for Windows memorizes coupler normalized response for maximum reflection and is ready for next measurement, which will indicate directivity as a direct measurement.
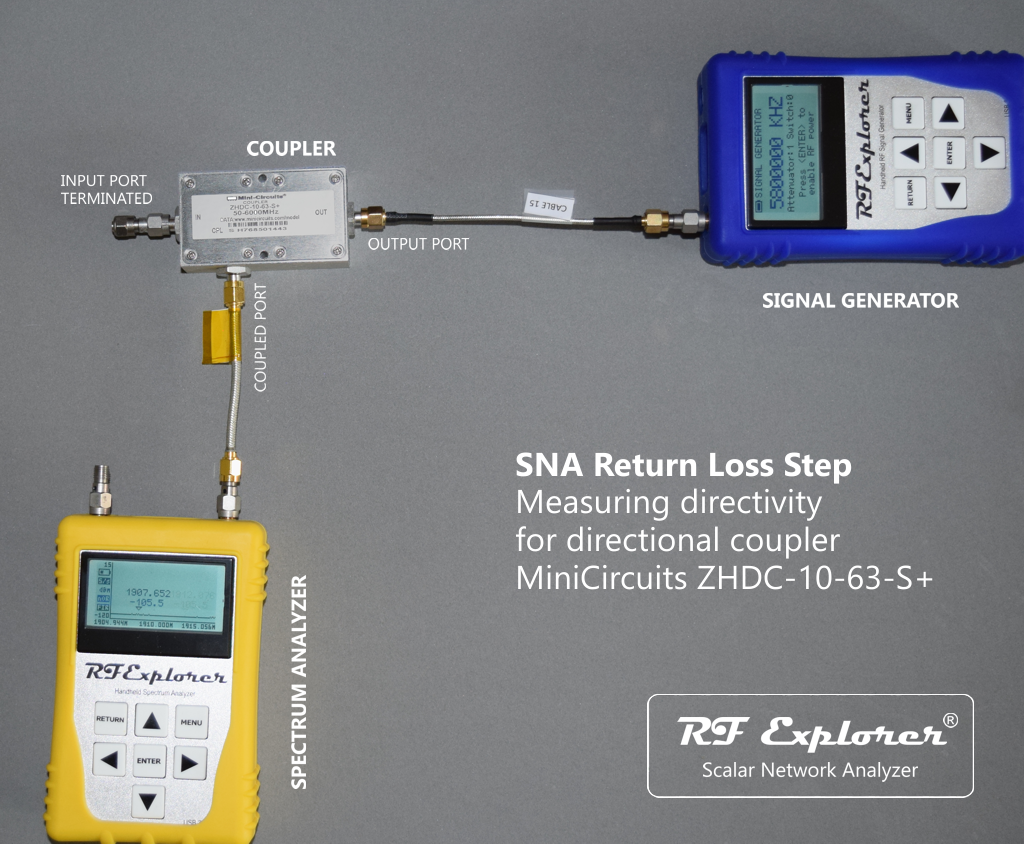
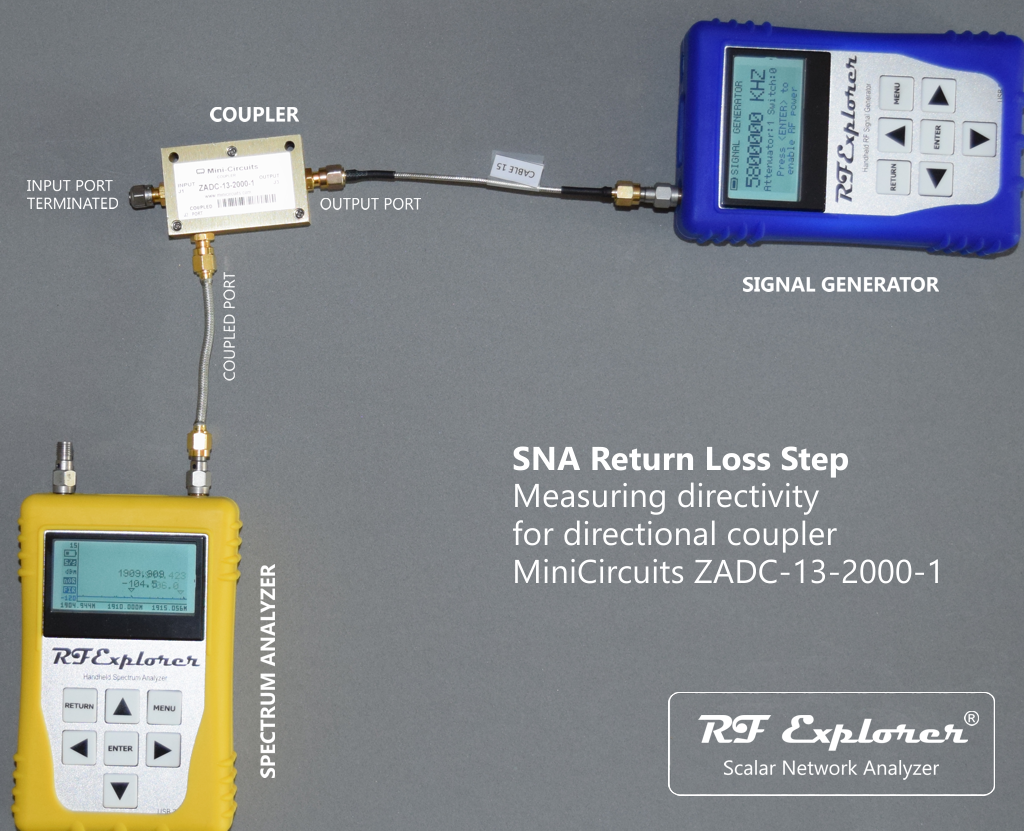
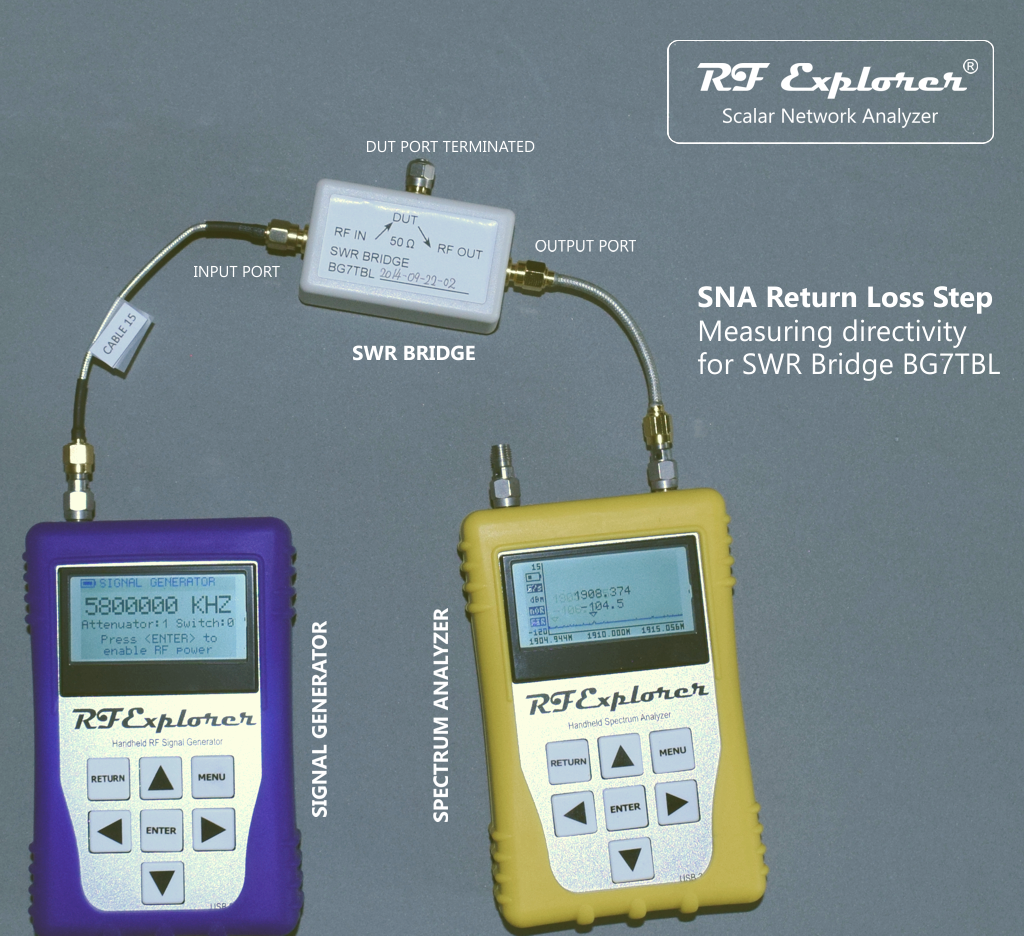
Now connect the termination load to the INPUT coupler pin, and [Start SNA] tracking. The response you will get is the best possible impedance match this coupler is able to measure, also known as Directivity.
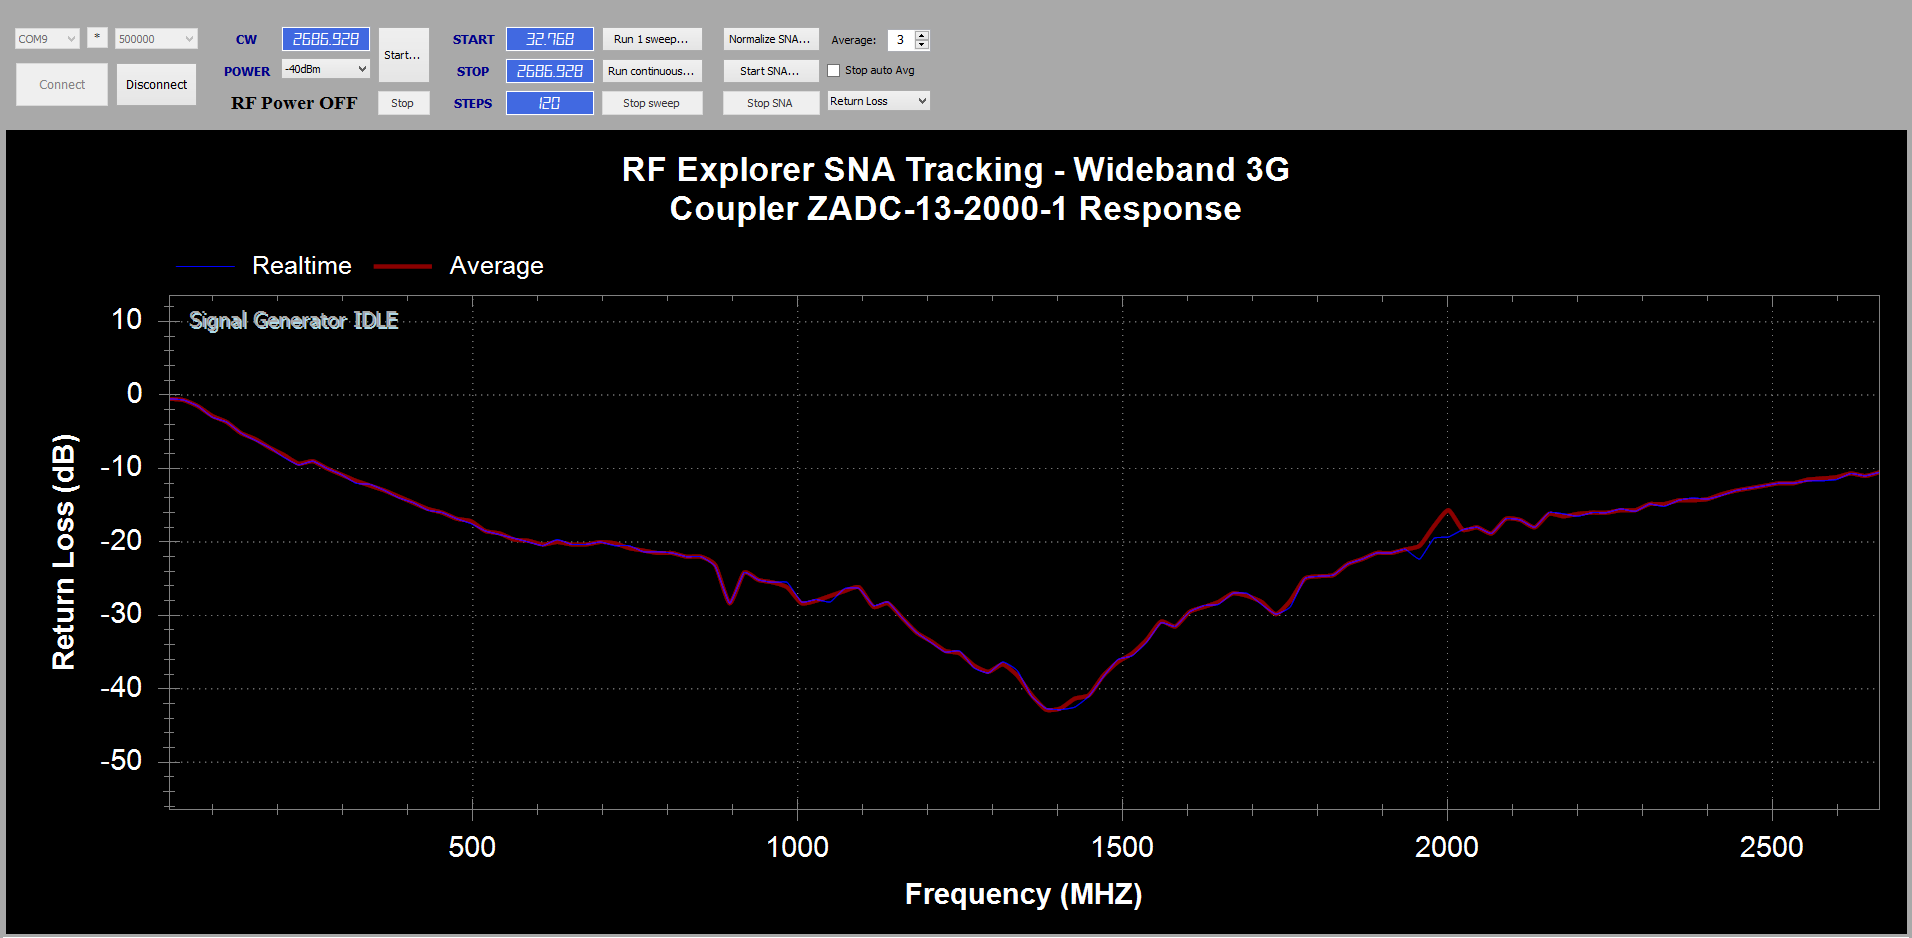
For the DC1 you will get this response for return loss
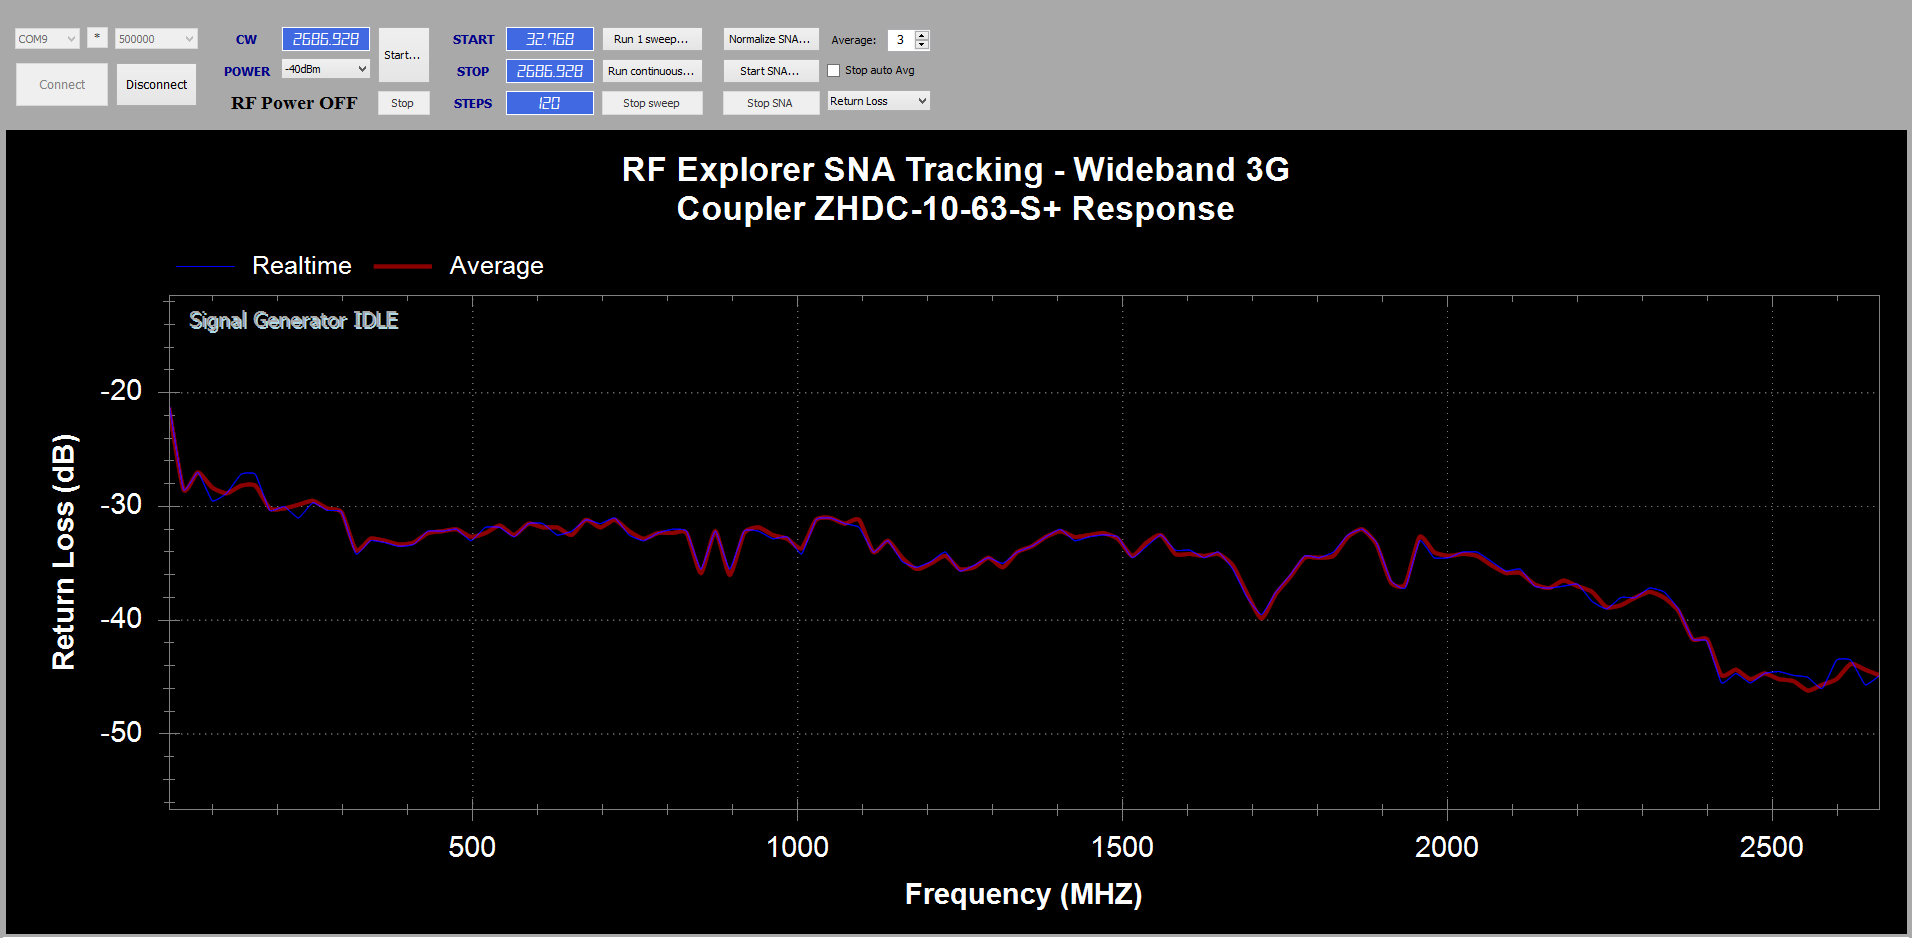
This is similar to that of the datasheet, actually a bit better. At high frequencies close to 2500MHz the directivity is exceeding 45dB in this unit.
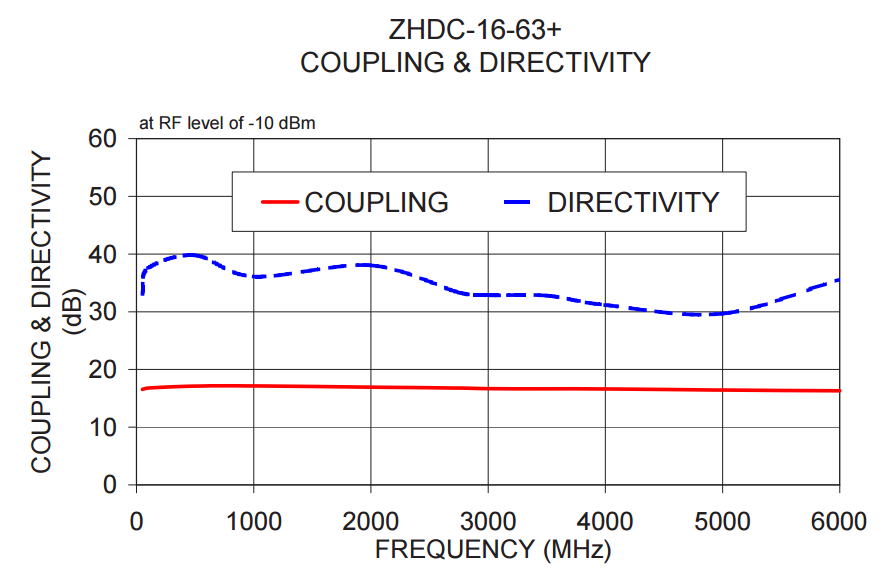
Note the reading is inversed sign, because the SNA measures return loss in dB (a negative value) whereas interpreting it as Directivity we must change the sign to positive. Therefore a return loss of -35dB translates to a Directivity of +35dB.
Measure Coupler DC2 Directivity
Repeating the process for this lower cost directional coupler, normalize with INPUT port open...
... then complete tracking with INPUT port correctly terminated
Results for directivity are also close but actually better than that of the datasheet
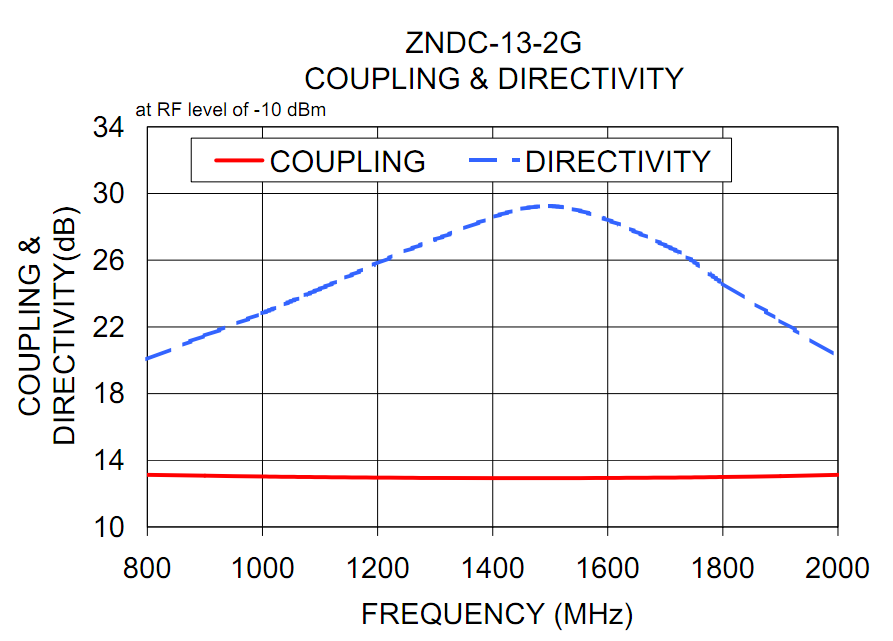
Note 20dB directivity starts at 600Mhz in this unit, which is better than 800MHz predicted by datasheet
Measure Coupler DC3 Directivity
The interesting difference about this coupler is that was produced as a SWR Bridge, and therefore the port connections come labelled as required for reflection measurement. That is not the case with standard directional couplers which comes labeled for normal coupler operation.
SWR Bridge is a special case of Directional Coupler. Both perform the same function, but they have the same physical ports marked differently. Make sure to observe correct connection for sensible results. This table below may be useful for reference connection when measuring reflection of a device.
| Connection | Directional Coupler | SWR Bridge |
| Signal Generator | Output port | Input port |
| Spectrum Analyzer | Coupled port | Output port |
| Device under test (DUT) | Input port | DUT or Coupled |
Normalization step as usual...
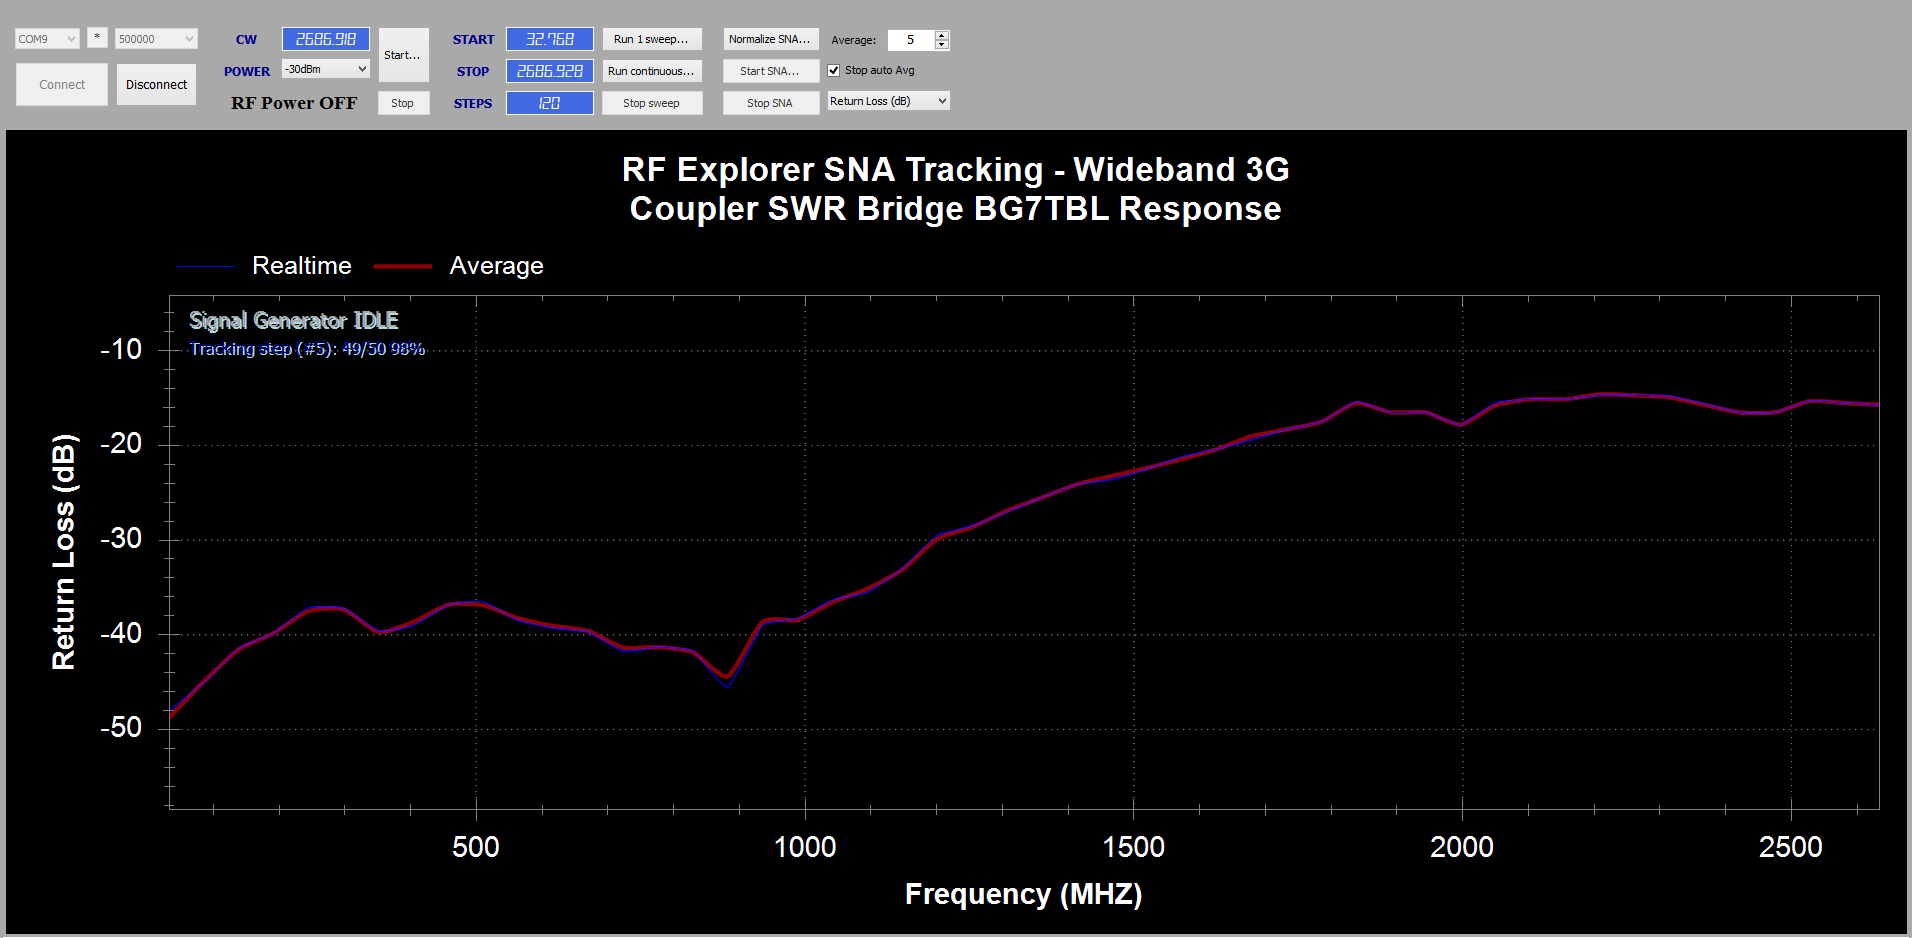
... then complete tracking
Results cannot be compared to a datasheet as we didn’t find any reliable info available, but the vendor advertise this as “1-500MHz with 30dB directivity or better” and we found to be better than that. This unit had a good 35dB directivity or better up to 1000MHz, and better than 20dB up to 1600MHz
Conclusions
Being directivity the most important parameter of a directional coupler used for reflection / VSWR measurement, it is very easy to characterize your coupler to know how good is in a particular frequency range.
Out of these 3 couplers presented here, it is no surprise the higher cost DC1 clearly outperforms the other two in range. However, DC2 can be used in a fraction of the range and, if combined with DC3, can provide a low cost combo for ranges 1-2000MHz. For higher frequencies, none of these two couplers DC2 or DC3 are recommended.
An upcoming follow up article will show how this directivity plays an important role when characterizing VSWR of a device. Stay tuned.