
Requirements
You may use a Seeeduino Stalker v02b to host the RFBee. Just plug the RFBee into the XBee slot. You also need a way to connect your Stalker to your PC to upload the sketch, I personally used a CP2102 USB bridge, you can use other USB bridges including the UartSBee recommended by Seeed.
Alternatively, you can do the same with an Arduino compatible board, but will have to connect the RFBee with RX/TX of the CPU using a XBee 2mm connector, which may not be easy to get at your local shop.
Finally, you will need two jumper cables to connect Stalker port 2 to GND and port 3 and GND. We will use them as simple switches to configure the RFBee in different ways. Feel free to check the trivial sketch code to better understand how it works, and make your own changes.
Some familiarity with RFExplorer and RFBee user manual is required, otherwise some steps may not be obvious.
Set RFBee to work
After you upload the script in the Stalker, power off the unit completely so both ATMegas (Stalker's and RFBee's) resets at the same time and you start from a clean state.
Power the unit back, it will start transmission automatically after Stalker led blinks 6 times.
RFExplorer will show received power and frequency. Play with antenna orientation till you get the best power response. In this tutorial we will use RFBee in 915Mhz, but equivalent results will be obtained in the 868Mhz. Take a look in the sketch code and uncomment the couple of lines coded for 868Mhz if your RF Explorer is in that band.
Monitor frequency response with RF Explorer
Power the Stalker OFF, then connect both ports 2 and 3 to GND with cables or switches. Power the Stalker back ON.
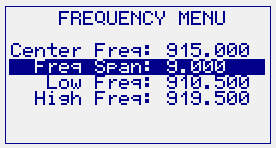
In RFExplorer Frequency Menu, select 915Mhz as center frequency as it is the expected carrier frequency from RFBee.
You want to start looking at a wider frequency span first, therefore select 9Mhz.
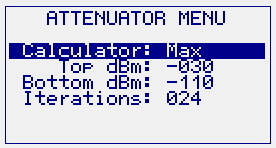
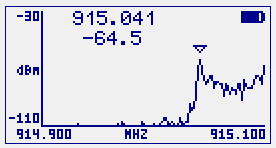
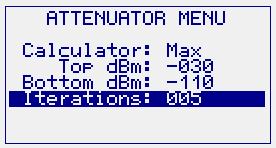
You may want to change your Attenuator Menu settings as well to use Max calculator and limit it to 24 iterations. Finally set top dBm reference to -30dBm
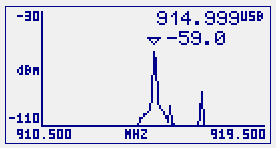
You should get something like this, assuming 1 meter distance between RFExplorer and RFBee.
We get a clear signal around 915Mhz. Note: If you don’t get that, some connection is wrong or the Arduino sketch wasn’t properly uploaded.
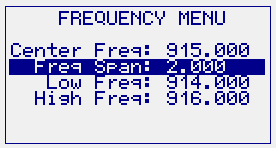
Now let’s see the received signal a bit closer, thus reduce the selected span to 2Mhz
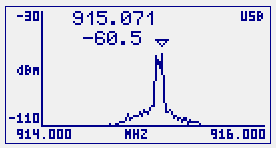
Note how signal becomes a bit wider in the X axis. This is expected because the visible area of the transmitted signal is now wider when compared to the frequency span. In other words, by reducing the span you are zooming in the frequency domain. As we zoom in more and more, we can get a better idea of spectrum shape. RF Explorer will let you define a Span as narrow as 100Khz, which is more than enough to get the finer detail of any digital signal in a ISM band.
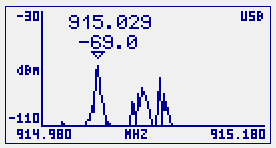
To get a better detail, reduce the span to 600Khz
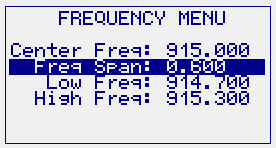
Note the shape doesn’t look like a single signal anymore: there are two clear peaks. We will see what those peaks are in a moment.
As the span gets narrower the signal details are shown with more resolution. This has a side effect: the peak mark (triangle on screen) can show a different value when compared to a wider span display.This is expected; the more resolution the better accuracy on frequency read. However, this come at a cost: as the resolution increases, the measurement time gets longer and thus you may notice the display takes longer to refresh.
Many high end spectrum analyzers will require some expertise to calibrate Sweep time, Resolution Bandwidth and Video Bandwidth as you change the frequency span. The good news is all this is handled automatically by the RF Explorer internal firmware, so we can concentrate in measurement only.
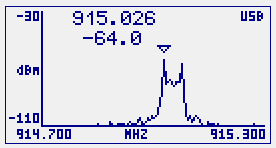
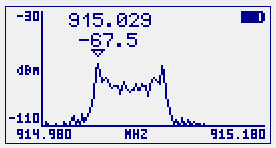
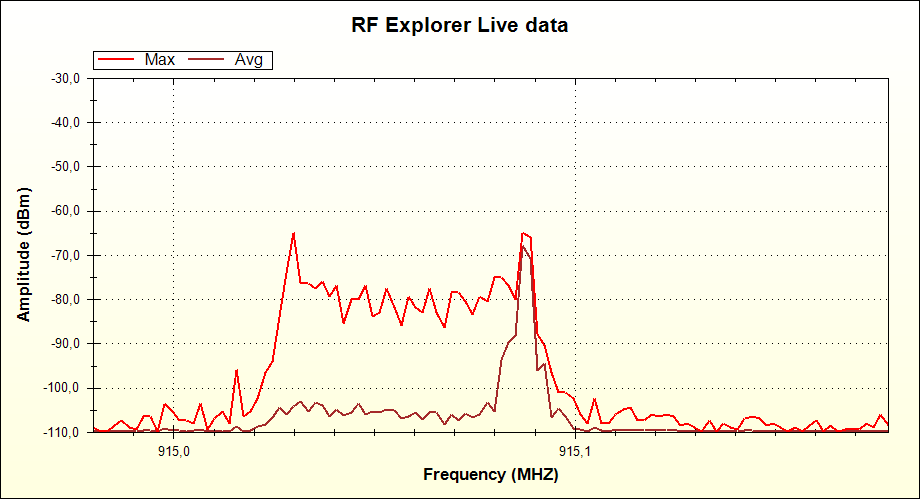
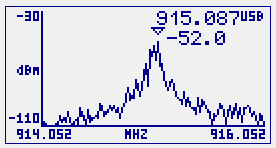
Let us now go to much finer detail inspection of this signal, reduce the span to 200Khz
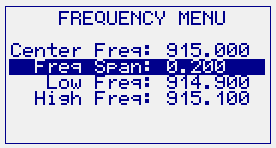
Note how we zoomed in one of the peaks, and the other is no longer visible. You may ask why is this signal not centered anymore. Actually, it wasn’t centered before, but with a wider span we didn’t notice.
With finer detail we can see now the RFBee is deviated a little bit from 915Mhz expected center frequency, and transmit a bit on the high side. Let’s then change the center frequency of the analyzer to get a centered response on the screen. In this case looks like the center of the shape is around 915.080 Mhz (or about 80Khz deviated from expected center):
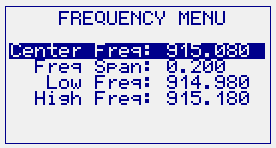
Not perfectly centered on screen, but close enough to visualize the full shape.
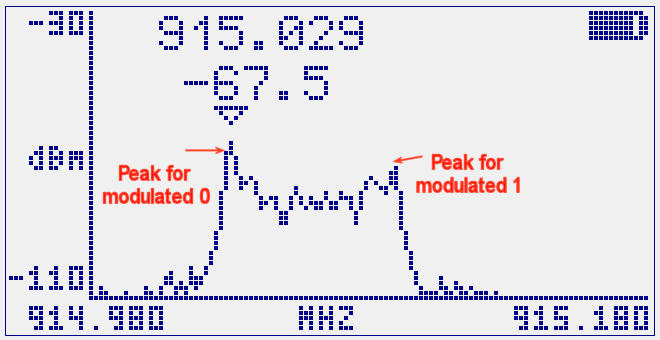
At this resolution, you can clearly identify both peaks, these are the two points representing 0 and 1 digital levels. Remember we are transmitting a digital frequency modulated signal with two possible values, zero or one. The modulator (transmitter) will translate a digital level 1 to a frequency, and a digital level 0 to a different frequency. The demodulator (receiver) will do exactly the opposite in order to recover the original digital signal.
If you look at the code in the Arduino script, you can see we are repeatedly transmitting a byte with all bits set to zeros (when both ports 2 and 3 are LOW i.e. connected to GND).
If we are transmitting only zeros, why we get two peaks in this signal?
The reason is the preamble most RF transceivers use to identify a new transmitted package, including of course the CC1101 embedded in the RFBee. This preamble is typically a collection of alternating zeros and ones. Under the hood, we transmit a payload of 8 bits set to zero but also a preceding preamble with alternating zeros and ones. Something like this, being repeated continuously in a loop:
10101010 - 00000000
[preamble] [payload]
As we configured RF Explorer to calculate Max of every sample, we are displaying the signal spectrum envelop with both zeros and ones together, regardless the zeros being more frequent (or dominant) than the ones.
This is getting interesting. If we know the zeros are more frequent than the ones, we should be able to detect that somehow, right?
There are a few ways to do that; the simpler way is with a change in the number of iterations the calculator uses to display Max values:
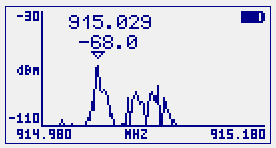
By reducing the number of samples the calculator averages, we effectively prioritize the part of the signal which is more frequent, and lower the weight of the infrequent. This now makes the transmitted zero display as a constant peak, with an animated signal moving continuously on the right. There is no longer a constant peak for the ones.
The fact that fewer iterations show an animated response is expected, remember the RFBee transmitter is sending intermittent packages rather than a continuous wave (CW). We knew that because the script is iterating in a Loop() and repeatedly sending packages of 1 byte (and yes, some preamble bits as well).
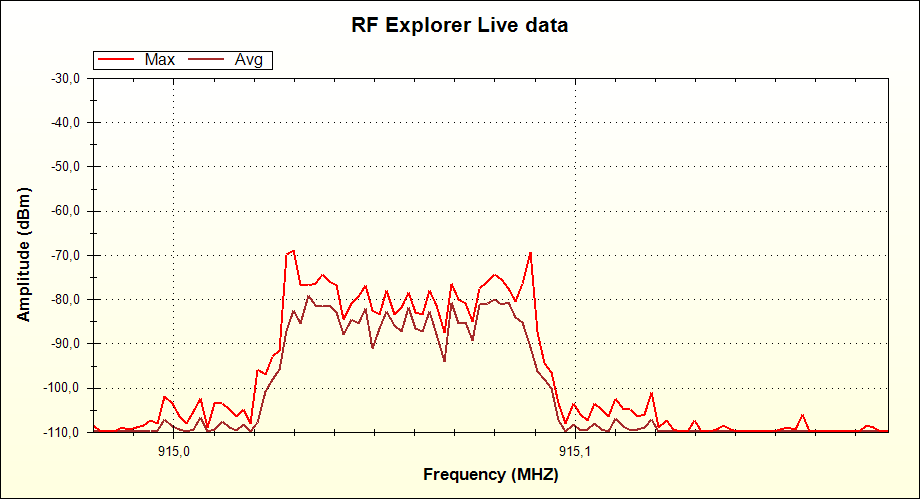
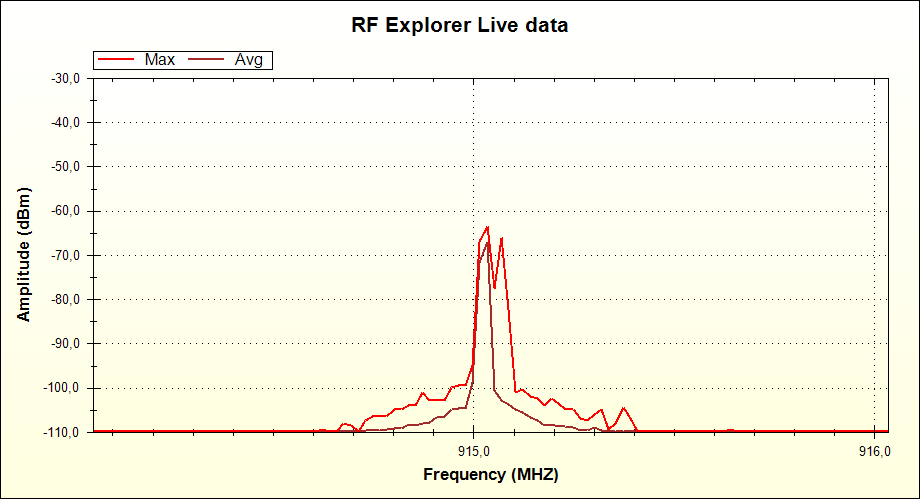
But let’s use the RF Explorer Windows PC Client to see this with better detail, in full color. Open it while the RF Explorer is connected to the USB port. Start with 24 iterations as we did in the RF Explorer, and check mark Max and Average only (we don't need Realtime nor Min values for this research, but you are free to activate and play with them as well).
You should get something like this (click on the image to enlarge it to full size):
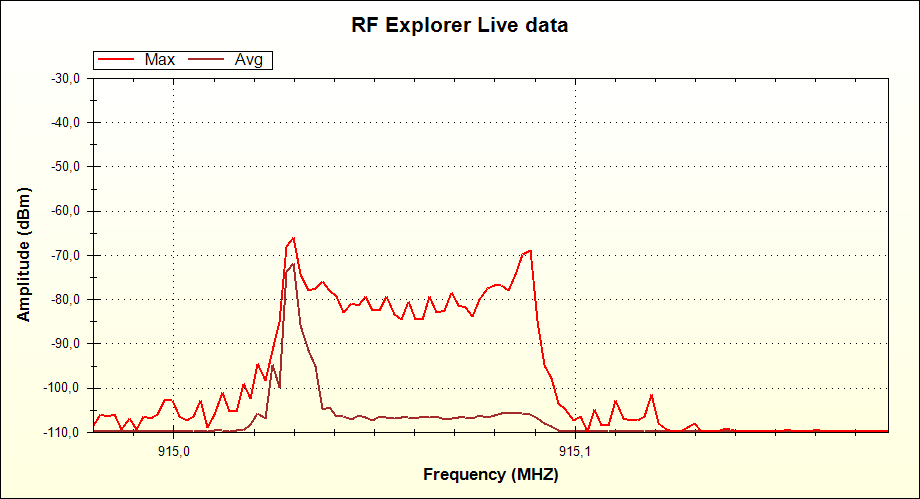
And that is really interesting.
The PC client, thanks to a better screen, show us the Max signal spectrum envelop as we saw it initially in the RF Explorer screen, but at the same time the Average value show us very clearly how the “zero” peak is way more frequent than the “one”. We are looking in the same graph, with great clarity, what we did in the RF Explorer screen with two different configurations. You know.... the PC is here to help!
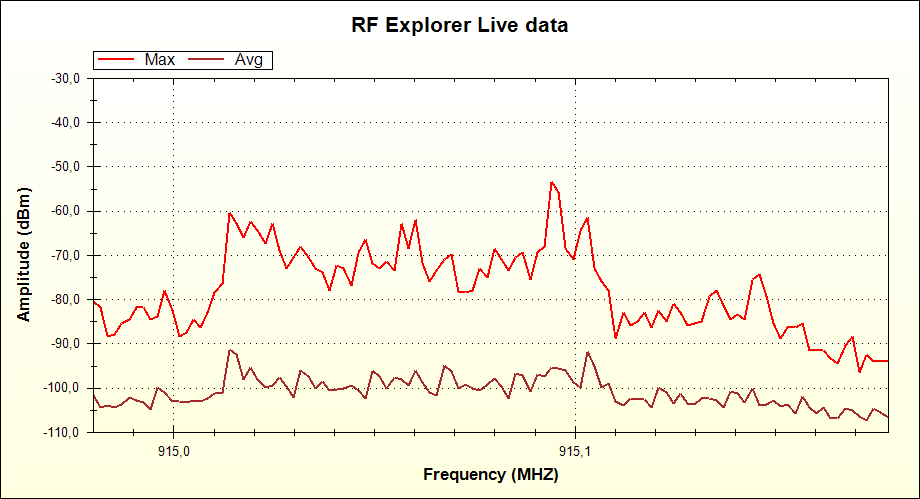
Now, if our interpretation of the modulated signal is correct, we should see just the opposite behavior when the RFBee transmit packages with ones, and not zeros…. Let’s check that: simply unplug both cables from port 2 and 3 out of GND, making them both high at the same time.
At that point, the RFBee will start transmitting this
10101010 - 11111111
[preamble] [payload]
And we should see a behavior change in the signal spectrum shape.
And that is exactly what we get; after a few iterations the calculator stabilizes and this is the new shape:
Now the higher averaged weight goes to the ones side as expected.
Can we distribute a modulated signal with equal number of zeros and ones?
Absolutely, just plug the port 3 only to GND, and keep the port 2 unplugged. After calculator stabilizes, you will see this
Now both peaks are weighted the same by the average calculator, because we are now transmitting this pattern from RFBee:
10101010 - 10101010
[preamble] [payload]
GFSK versus FSK
Let’s do one last experiment with RFBee and RFExplorer together. We have been using the GFSK low speed 4.8Kbps setting as we had the port 2 connected to GND when the unit was powered on.
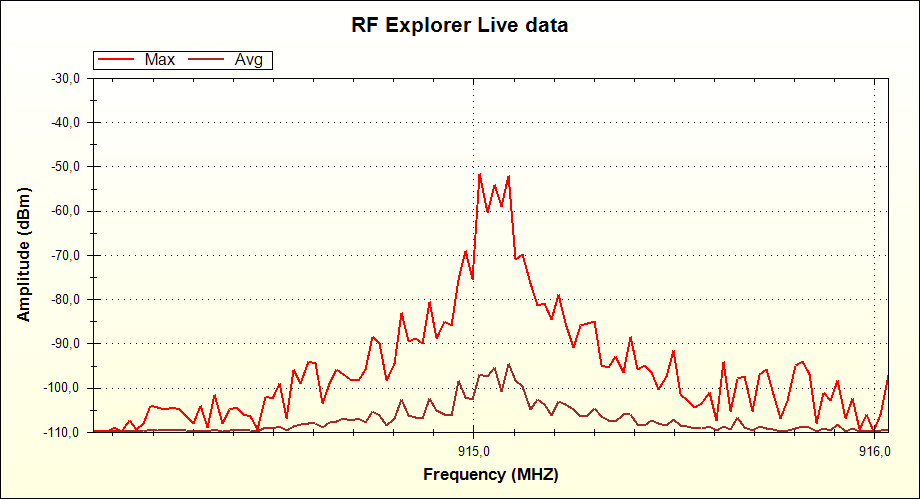
Let us now change that and see the result. Unplug both cables out of GND, and recycle power in Stalker.
After everything stabilizes, we will get something very different:
There are two reasons for this change.
First of all, GFSK modulation is a much cleaner signal than FSK. This is because GFSK process filters out spurious to a much narrower transmission bandwidth than FSK. But in addition to that, we are now transmitting at 76.8Kbps which has a much wider bandwidth than 4.8Kbps we used before.
Let’s change the span now to 2Mhz to get a better idea of how dirty this new signal is when compared to our previous GFSK at the same span.
Compare FSK 78Kbps...
With GFSK 4.8Kbps
Same signals in the RF Explorer screen (left is FSK, right is GFSK):
You can see a significant difference in band occupancy.
If you want to go deeper in some of these topics, check Wikipedia for GFSK, FSK and Bandwidth. You may want to read FM and Modulation articles as well to get a better idea of how a phase or frequency modulated signal can be interpreted in the frequency domain.
But usually is way more interesting and informative to experiment with a nice device like RFBee + Stalker to understand how it behaves using a tool like RF Explorer spectrum analyzer. You may also want to use this setup to finetune the RFBee firmware and add new modes, such as a high speed GFSK, and see the results, or change the antenna and look for more power in the transmitted signal.
Any question or comments in groups.google.com/group/rf-explorer.
Download the Arduino sketch here (link)