
Monitor frequency response with RF Explorer
Power the Stalker OFF, then connect both ports 2 and 3 to GND with cables or switches. Power the Stalker back ON.
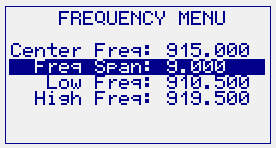
In RFExplorer Frequency Menu, select 915Mhz as center frequency as it is the expected carrier frequency from RFBee.
You want to start looking at a wider frequency span first, therefore select 9Mhz.
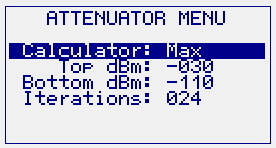
You may want to change your Attenuator Menu settings as well to use Max calculator and limit it to 24 iterations. Finally set top dBm reference to -30dBm
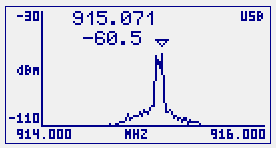
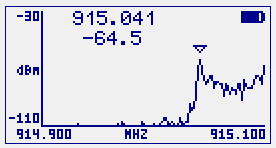
You should get something like this, assuming 1 meter distance between RFExplorer and RFBee.
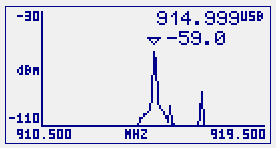
We get a clear signal around 915Mhz. Note: If you don’t get that, some connection is wrong or the Arduino sketch wasn’t properly uploaded.
Now let’s see the received signal a bit closer, thus reduce the selected span to 2Mhz
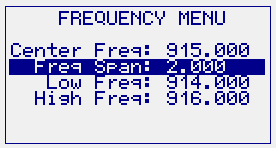
Note how signal becomes a bit wider in the X axis. This is expected because the visible area of the transmitted signal is now wider when compared to the frequency span. In other words, by reducing the span you are zooming in the frequency domain. As we zoom in more and more, we can get a better idea of spectrum shape. RF Explorer will let you define a Span as narrow as 100Khz, which is more than enough to get the finer detail of any digital signal in a ISM band.
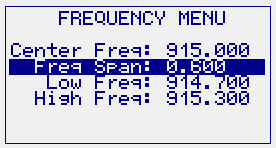
To get a better detail, reduce the span to 600Khz
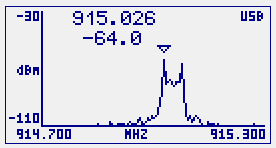
Note the shape doesn’t look like a single signal anymore: there are two clear peaks. We will see what those peaks are in a moment.
As the span gets narrower the signal details are shown with more resolution. This has a side effect: the peak mark (triangle on screen) can show a different value when compared to a wider span display.This is expected; the more resolution the better accuracy on frequency read. However, this come at a cost: as the resolution increases, the measurement time gets longer and thus you may notice the display takes longer to refresh.
Many high end spectrum analyzers will require some expertise to calibrate Sweep time, Resolution Bandwidth and Video Bandwidth as you change the frequency span. The good news is all this is handled automatically by the RF Explorer internal firmware, so we can concentrate in measurement only.
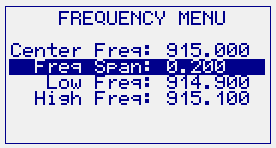
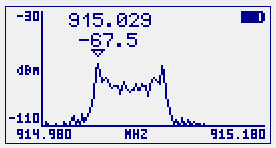
Let us now go to much finer detail inspection of this signal, reduce the span to 200Khz
Note how we zoomed in one of the peaks, and the other is no longer visible. You may ask why is this signal not centered anymore. Actually, it wasn’t centered before, but with a wider span we didn’t notice.
With finer detail we can see now the RFBee is deviated a little bit from 915Mhz expected center frequency, and transmit a bit on the high side. Let’s then change the center frequency of the analyzer to get a centered response on the screen. In this case looks like the center of the shape is around 915.080 Mhz (or about 80Khz deviated from expected center):
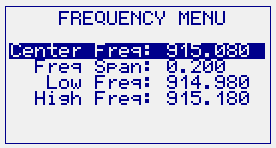
Not perfectly centered on screen, but close enough to visualize the full shape.